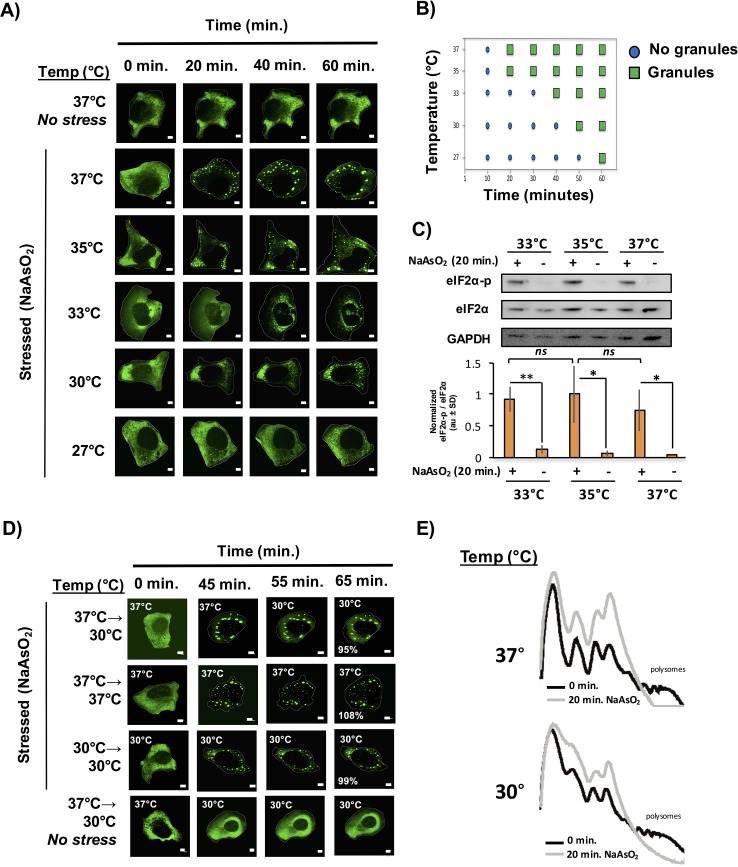
Figure 6. Temperature inversely affects kinetics of stress granule formation.
(A) Time-lapse microscopy of U-2 OS cells expressing GFP-G3BP1. U-2 OS cells imaged at respective temperatures in the presence of NaAsO2 stress for 1 hr using 100X objective. (B) Graphical representation of temperature on stress granule formation in U-2 OS cells. (C) Western blot for eiF2α phosphorylation status following +/− exposure to 20 min of NaAsO2 stress at respective temperatures. eiF2α and GAPDH serve as loading controls. Normalized to total eiF2α (N=3, au = arbitary units, SD = standard deviation). (p-value: *<0.05; **<0.01; ns = not significant). (D) Time-lapse microscopy of U-2 OS cells expressing GFP-G3BP1 at respective temperatures following 45 min NaAsO2 stress using 100X objective. Temperatures at which cells were imaged are indicated in top left of each panel. Percentages listed in final panel represent average area of granules normalized to the area of granules at the start of image acquisition. (E) Polysome analysis of U-2 OS cells (grown either at 30°C or 37°C) during steady state or following 20 min NaAsO2 stress. All scale bars are 5 μm.

