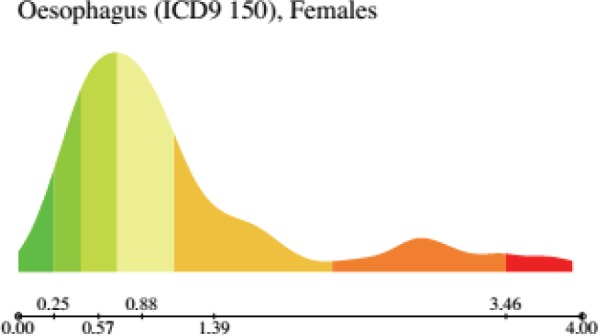
Figure 1. Histogram of the distribution of oesophagus cancer (ICD9 150, corresponding to ICD10 C15) mortality in females in EU and EEA. Note that the distribution is clearly bimodal. Note that, in the cancer-sex relative scale, the colouring map derives from the quantiles of this distribution. From: P. Boyle and M. Smans (2008). Atlas of Cancer Mortality in the European Union and the European Economic Area 1993–1997. IARC Scientific Publication n°159. Lyon, France: International Agency for Research on Cancer.

