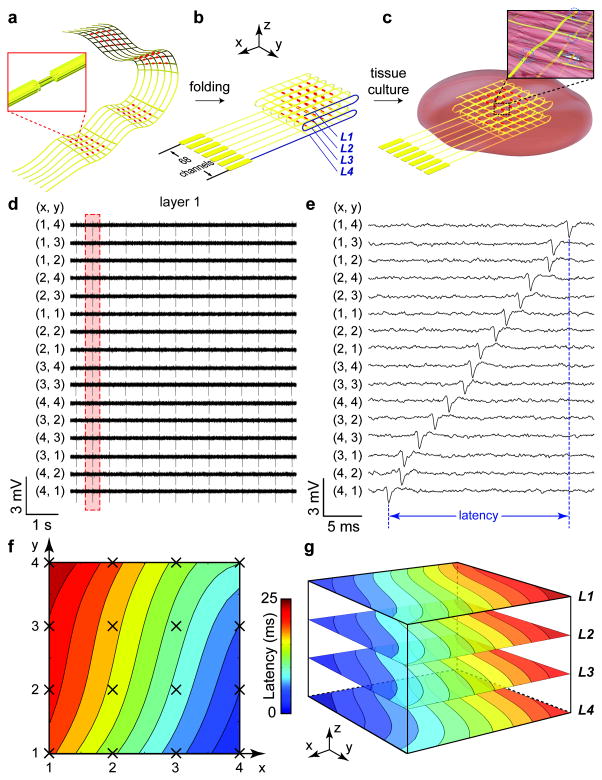
Figure 1. 3D spatiotemporal mapping of APs.
(a) Schematic of free-standing macroporous nanoelectronic scaffold with nanowire FET arrays (red dots); inset, one nanowire FET. In (a–c), a limited number of input/output leads are shown for clarity; the total for the design as indicated in (b) is 68. (b) Folded 3D free-standing scaffolds with four layers of individually addressable FET sensors. (c) Schematic of nanoelectronic scaffold/cardiac tissue resulting from culture of cardiac cells within the 3D folded scaffold; inset, nanoelectronic sensors (blue circles) innervate the 3D cell network. (d) Simultaneous traces recorded from 16 sensors in the top layer (L1) from nanoelectronics-cardiac tissue. The (x,y) coordinates of each element from the 4 × 4 array are shown. (e) Zoom-in view of a single AP spike recorded from each device during the time indicated by the dashed-box in (d). The time latency between APs recorded from different devices is evident and specifically indicated for FETs (4,1) to (1,4). (f) Isochronal map of time latency in L1; mapping area is ca. 25 mm2. (g) 3D isochronal map of time latency through the sample, where L1–L4 correspond to the four layers of 4 × 4 device arrays innervating the cardiac tissue. Mapping area is ca. 25 mm2 × 200 μm.

