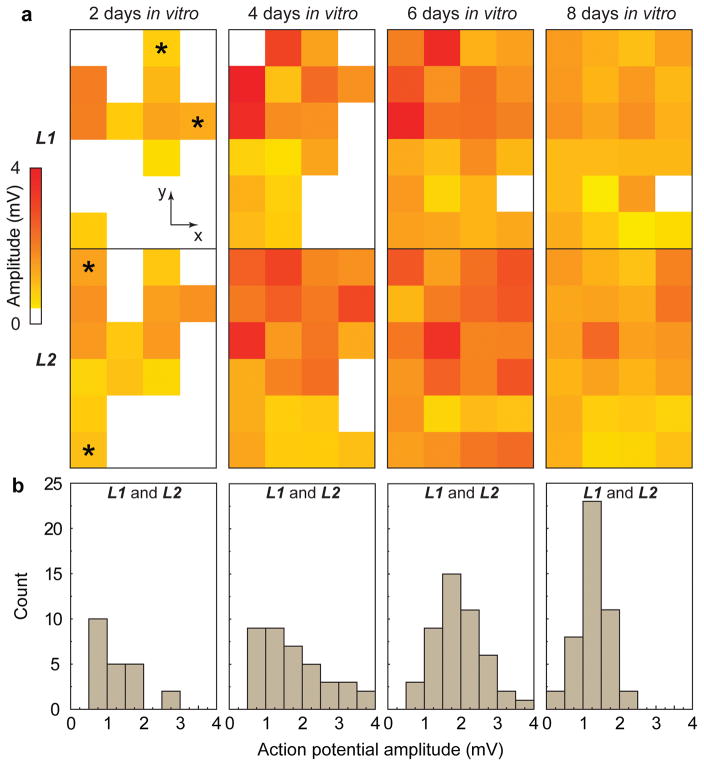
Figure 2. AP evolution during tissue development.
(a) Amplitudes of spontaneous extracellular APs recorded from 4 × 6 nanowire FET arrays in two layers at 2, 4, 6 and 8 DIV. White squares correspond to coordinates where extracellular APs are absent or below the detection limit (1× standard deviation of noise level). Time-dependent data recorded from four devices (2 × L1 and 2 × L2) indicated with asterisks at 2 DIV are shown in Supplementary Fig. 5. (b) Histogram of extracellular AP amplitudes recorded from the 3D nanoelectronics-cardiac tissue sample at 2, 4, 6 and 8 DIV.

