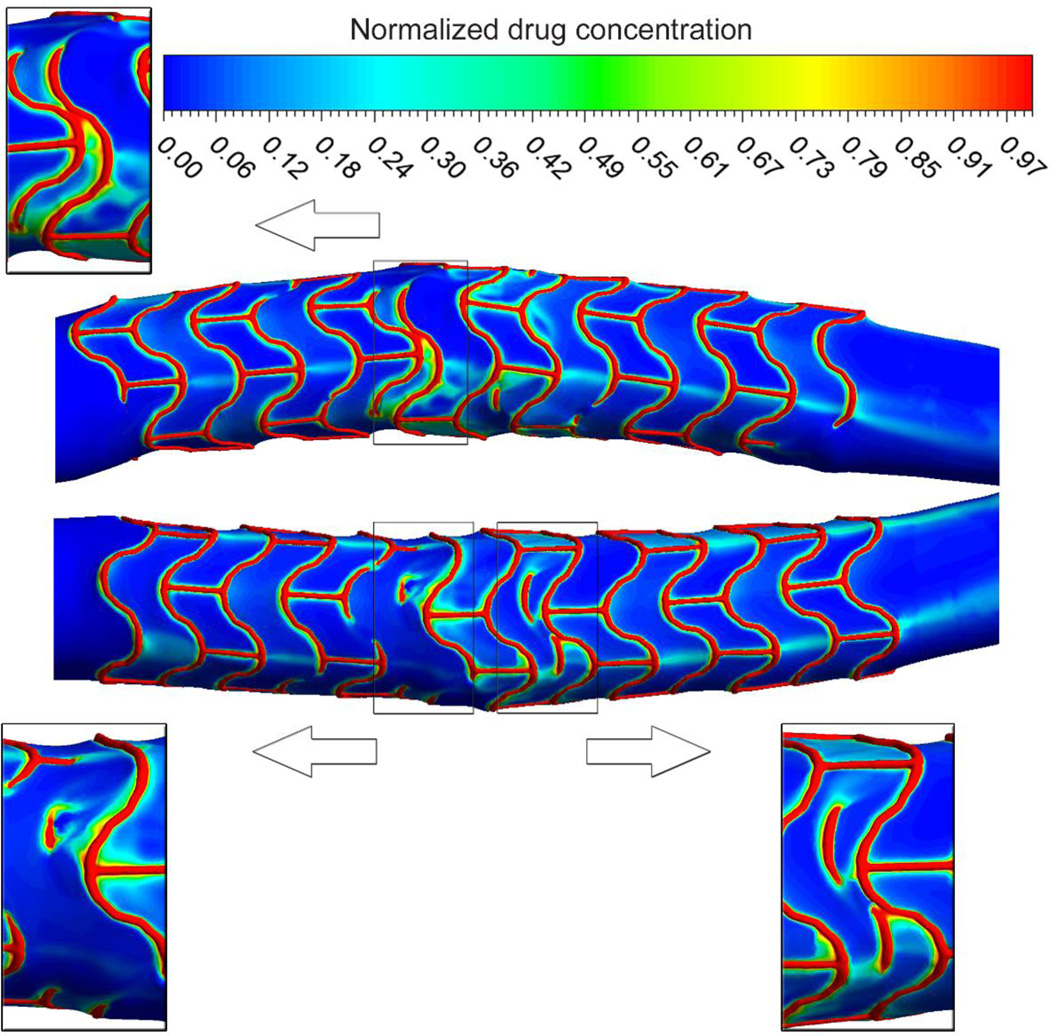
Figure 2.
Mural drug deposition in an artery. Insets show magnified views of drug concentration pattern in different locations in the vicinity of stent overlap. Values are given relative to the drug concentration on the stent surface. Higher drug concentrations are evident in areas where the stent struts overlap. Asymmetric pattern of drug deposition and also signs of convectively-delivered drug are observed

