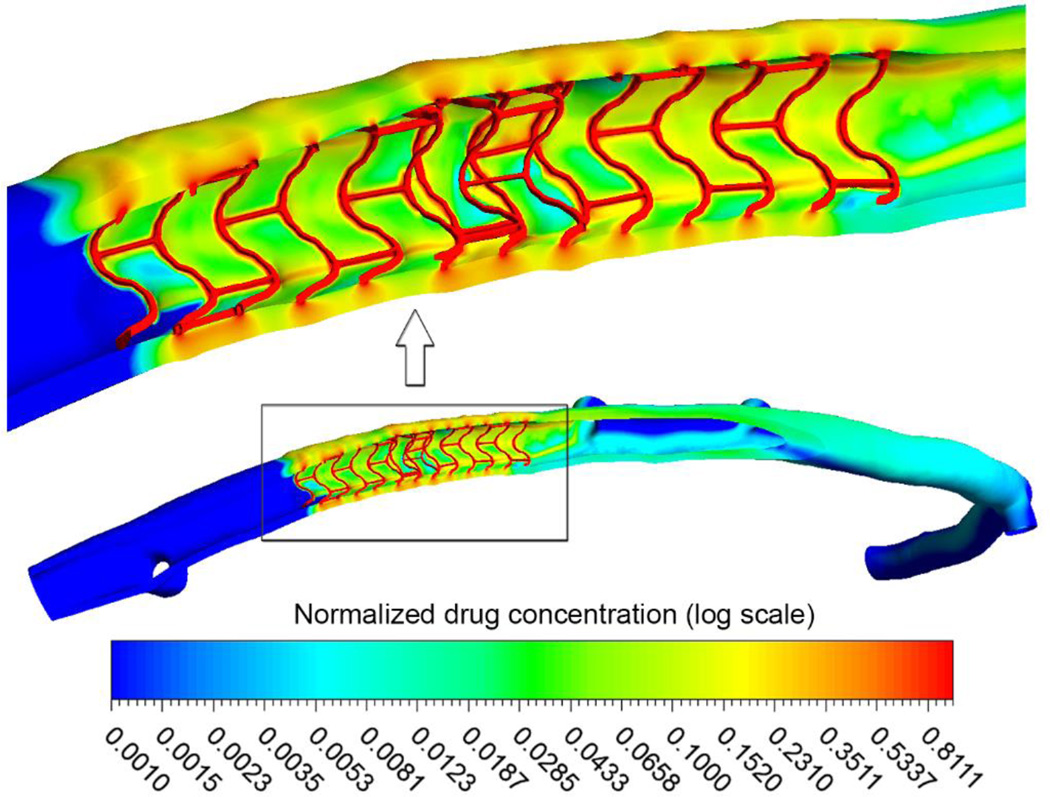
Figure 3.
Concentration of deposited drug (shown in logarithmic scale) on the mural interface and in the arterial wall. Values are given relative to the drug concentration on the stent surface. Inset shows a high magnification view of the drug concentration pattern in the stented segment. High drug deposition is noticed in the overlap region, especially where struts are in close proximity, and distal to inter-strut connectors.

