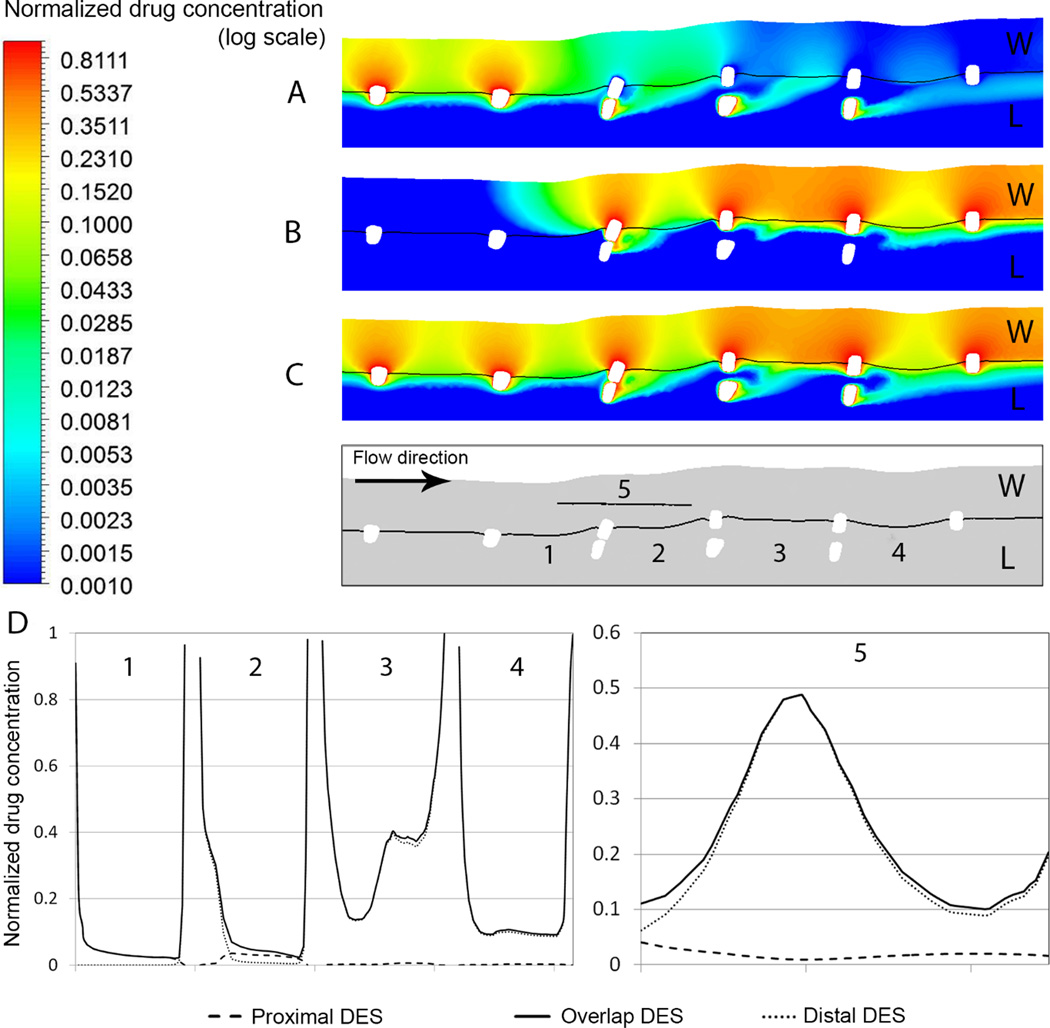
Figure 4.
Drug concentration map in a section plane through two congruent struts in cases of drug elution by (A) the proximal (B) the distal and (C) both stents. Values are given relative to the drug concentration on the stent surface. W and L stand for the wall and lumen region, respectively. Drug pooling as a result of flow recirculation is evident at the site of overlap. (D) Plots of drug concentration along the lines (1) to (5) as defined in the section plane below panel (C). Lines (1) to (4) are located on the mural surface, whereas line (5) is midway inside the arterial wall right beneath two congruent struts.

