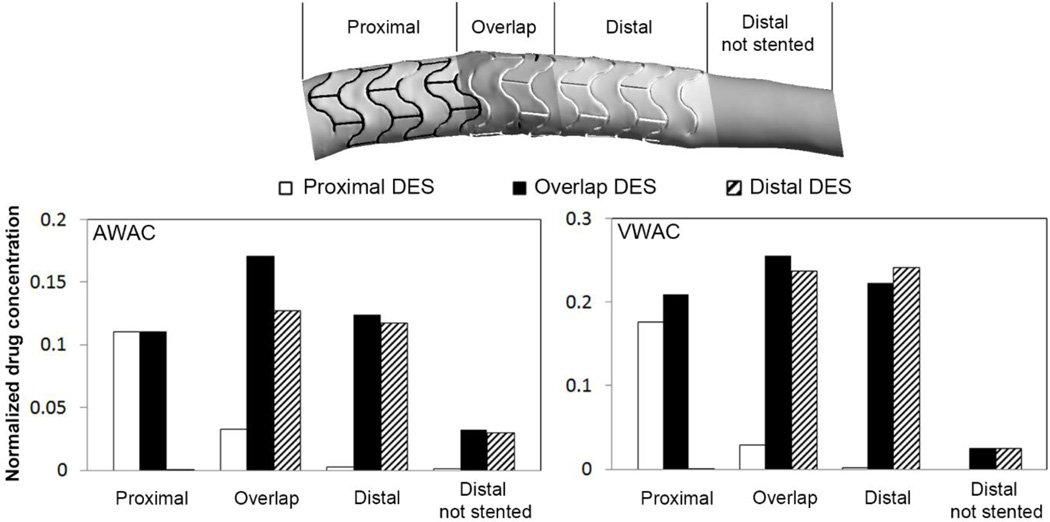
Figure 6.
Quantification of the drug concentration on the mural surface and inside the wall of different segments of stented artery as defined in the schematic at the top. The values for the mural surface are given as the area weighted average of drug concentration (AWAC, left chart). For the arterial wall they are given as volume-weighted average of drug concentration (VWAC, right chart) within the arterial tissue. Values are given relative to the drug concentration on the stent surface. AWAC and VWAC are higher in the overlap segment than in the proximal and distal regions when both stents elute drug. This is due to higher load of drug available and flow-mediated drug deposition.

