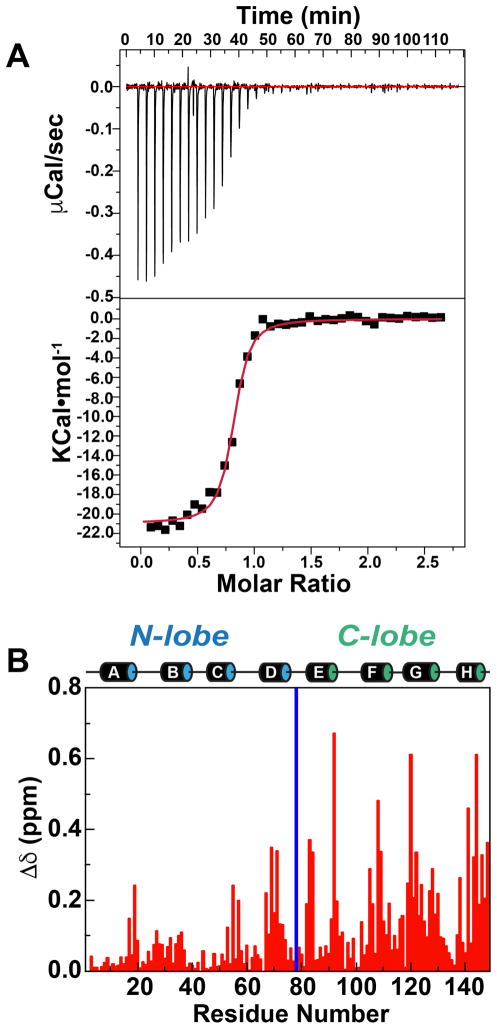
Figure 2. Interaction between eEF-2KCBD with CaM in the presence of Ca2+.
(A) ITC trace representative of three repeats is shown. For the trace shown, KD=137.2±18.8 nM, ΔH=−16.6 KCal•mol−1, ΔS=−22.5 Cal•mol−1•K−1. (B) Backbone amide chemical shift perturbations induced on Ca2+-CaM upon formation of the 1:1 Ca2+-CaM•eEF-2KCBD complex. The locations of the eight helices (A, B, C, D on the N-lobe and E, F, G, H on the C-lobe) are shown. The blue bar represents residues that are unassigned in the Ca2+-CaM•eEF-2KCBD complex.

