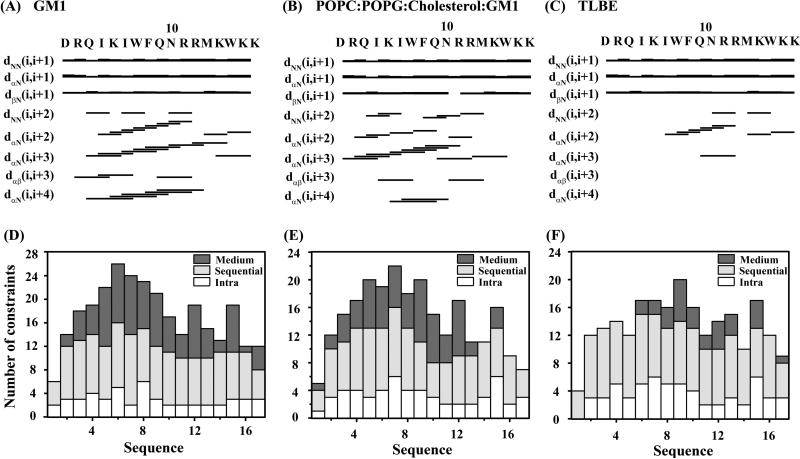
Figure 5.
(Upper panel) NMR structural parameters of DK17 in the context of different LUVs, obtained from trNOESY spectra. Bar diagram representing various NOE (sequential, medium range, and long range) contacts of DK17 in the presence of GM1 (A), POPC:POPG:Cholesterol:GM1 (B) and TLBE (C) LUVs. The thickness of the bars indicates the intensity of the NOESY peaks, which are denoted as strong, medium, and weak. (Lower panel) A histogram representing the number and variety (intra, sequential, medium) of NOEs of DK17 as a function of residue number in complex with GM1 (D), POPC:POPG:Cholesterol:GM1 (E) and TLBE (F) LUVs.

