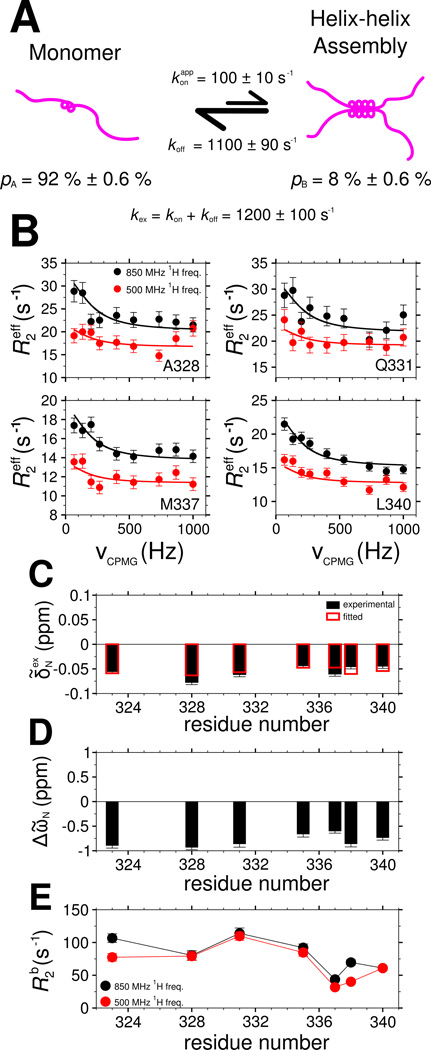
Figure 7.
Characterization of TDP-43 C-terminal domain interaction dynamics by 15N CPMG relaxation dispersion. See also Figure S5. (A) A two-state model for TDP-43 C-terminal domain interaction at 45 µM in which a population of monomers (pA) is in equilibrium with a multimeric assembled state (pB) governed by a global exchange rate kex. (B) Relaxation dispersion profiles and (C) exchange-induced 15N chemical shifts measured (circles, B; filled boxes, C) and calculated (lines, B; open boxes, C) by simultaneous optimization. Best-fit values of model parameters: (D) 15N chemical shift differences (ΔῶN) between the assembled and monomeric state and (E) 15N transverse relaxation in the assembled state (R2b). Data are plotted as mean ± SD.

