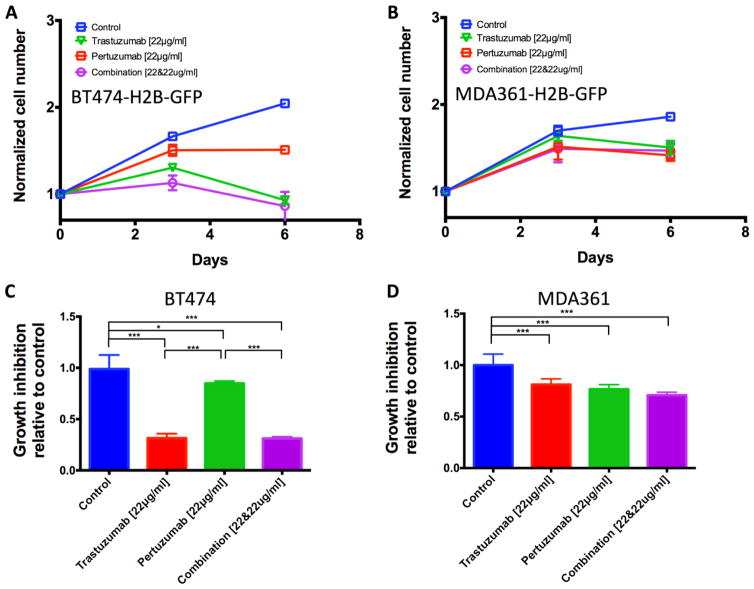
Figure 2.
(A–B) Growth curves (relative cell number to Day0 at days 3 and 6) for fluorescence expressing BT-474-HB2-GFP (A) and MDA-MB-361-H2B-GFP (B) cells treated with trastuzumab (red), pertuzumab (green) or both antibodies (magenta) at a concentration of 22 μg/ml. Controls received no treatment (blue).
(C–D) Endpoint measurement of growth inhibition relative to cells without treatment for BT-474 cells (C) and MDA-MB-361 (D) after six days of exposure to trastuzumab, pertuzumab or the combination at 22 μg/ml.

