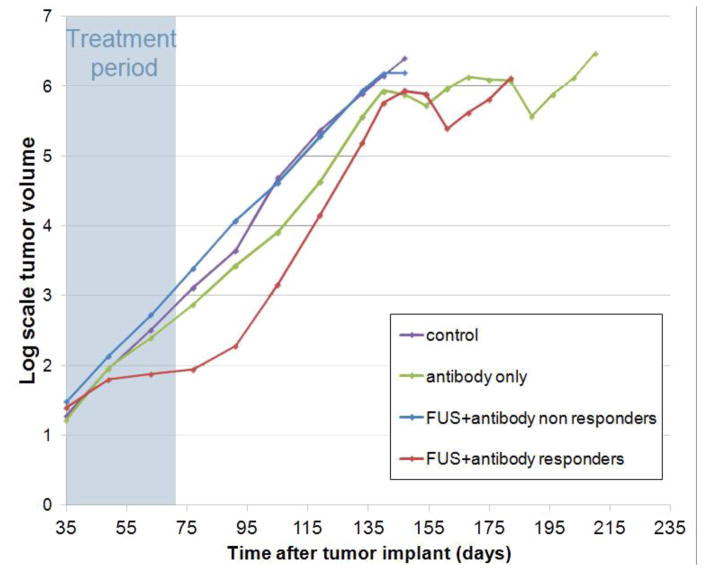
Figure 4.
Tumor volume measurements for each group from the start of the treatment period (day 35) till sacrifice. The measurements were obtained every other week. Four rats in the FUS+antibody group were classified as responder during the treatment period. After treatment, their growth curves follow the same pattern as the other groups.

