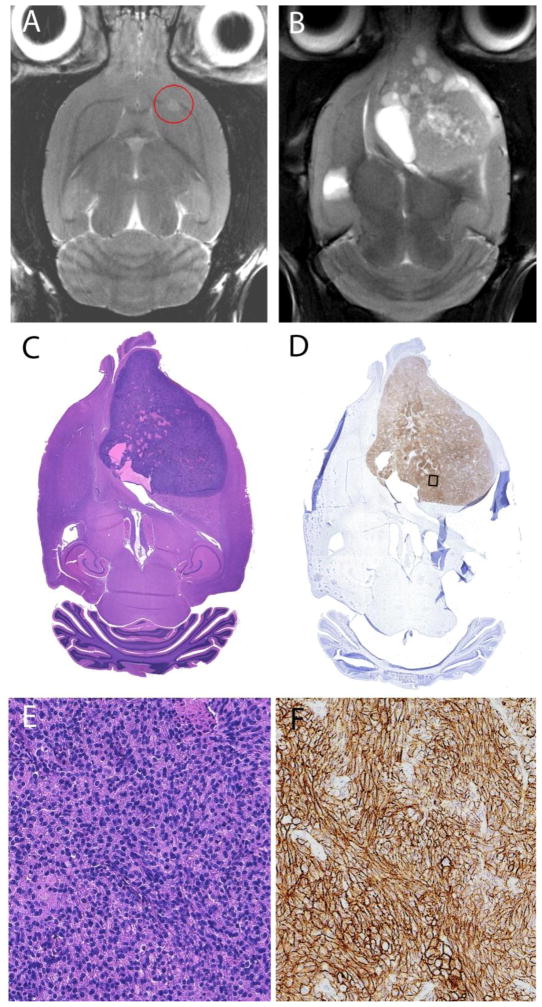
Figure 7.
MRI images and histology of a FUS+antibody animal who was classified as a responder. A) Tumor on MR imaging 5 weeks after implantation. B) Tumor on MR imaging when the animal reached the study endpoint. C) The hematoxylin & eosin-stained section has, like the MR image, a heterogeneous appearance with cystic areas, which was observed also in the other animals at the study endpoint. D) HER2-stained section confirms that the tumor is HER2-expressing. The box indicates the location of the enlargements in E (H&E) and F (HER2).

