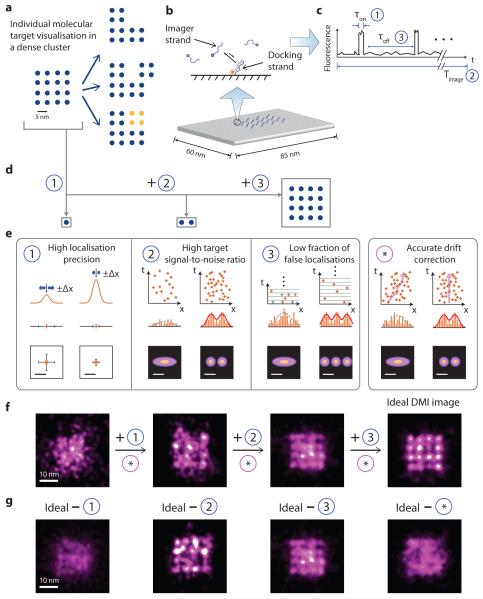
Figure 1. Principle and requirements of discrete molecular imaging (DMI).
(a) Concept of super-resolution discrete molecular imaging, illustrated with point array representation (blue points represent individual molecular targets, yellow points represent chemical modifications). Left, a regular 16-component biomolecular complex; right, its various forms of structural and chemical variations.
(b) Illustration of DNA-PAINT principle: transient binding between a docking strand and dye-conjugated imager strands (top), illustrated on a synthetic DNA origami nanostructure, where each cylinder represents a DNA double helix (bottom).
(c) Schematic DNA-PAINT blinking time trace of a single imaging target. Three blinking characteristics measure (1) blinking on-time, τon, (2) total imaging time, Timage and (3) blinking off-time, τoff, and can be tuned to meet the three blinking requirements in (e).
(d) Schematics of different substructures from the complex in (a): a single target, a pair of close-by targets, and a dense lattice, which need different blinking requirements in (e) to be clearly visualised.
(e) Technical requirements for achieving discrete molecular imaging. Each panel outlines one technical requirement, and depicts schematically the effect on imaging quality before (left column) and after (right column) the requirement is satisfied. For each condition, intensity profile in 1D (top), fitted Gaussian centres in 1D (middle) and 2D (bottom) are shown for requirement (1); localisation time trace in 1D (top), localisation histogram in 1D (middle) and 2D (bottom) are shown for requirements (2), (3) and (*). Orange lines and crosses indicate localisations. Orange bars depict localisation histograms. Solid red lines and dotted grey lines indicate successful and failed Gaussian fittings on localisation histograms, respectively. In panel 3, grey crosses indicate true localisations eclipsed by false double-blinking localisations. The same numbering for technical requirements (1)-(3) is also used in Fig. 2 and 4, and Supplementary Figure S2.
(f-g) Simulations of imaging effects of the technical requirements for the complex in (a), under increasingly better imaging conditions without stage drift (f), or under non-ideal imaging conditions with one of the four requirements unsatisfied (g).
See online methods and Supplementary Methods S2 for simulation details, and Supplementary Notes S7 for discussions. Scale bars: schematic length scale 5 nm in (a) and (e), 10 nm in (f) and (g).

