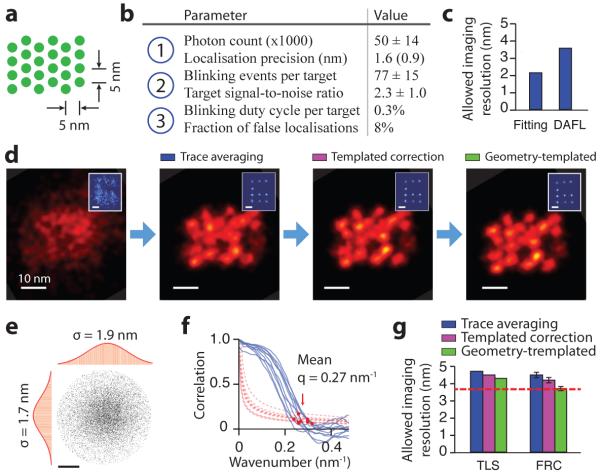
Figure 4. Systematic quality analysis of 5 nm grid super-resolution image.
(a) Design schematics of a 4 × 6 triangular grid structure with ~5 nm point-to-point spacing on a DNA origami nanostructure. Each green dot indicates a docking strand.
(b) Critical imaging quality parameters for the three blinking requirements. Localisation precision value in brackets was measured by single-molecule fitting uncertainty.
(c) Allowable imaging resolution assayed by two methods before drift correction, single-molecule fitting uncertainty (Fitting) and distance between adjacent-frame localisations (DAFL), both estimated in FWHM.
(d) Comparison of DNA-PAINT images of a 5 nm grid structure and a 20 nm grid drift marker (blue, inset) at different stages of drift correction.
(e, f) Measured imaging resolution assayed by two methods after drift correction.
(e) Target localisation spread (TLS). The point cloud shows overlapped localisations from individually separable targets and aligned by centre of mass. Histograms are shown for horizontal (left) and vertical (top) projections. Red curves indicate Gaussian fit.
(f) Fourier ring correlation (FRC). Correlation curves (blue, solid lines) and noise-based cutoff (red, dotted lines) are shown for 10 representative images; red dots indicate crossing points.
(g) Comparison of measured imaging resolution at different stages of drift correction, assayed by TLS and FRC. Red dashed line indicates localisation precision-limited best allowable resolution (as determined by DAFL).
DNA-PAINT imaging conditions used for this experiment: 400 ms frame time, 40,000 total frames, and 1 nM imager strand concentration. See online methods, Supplementary Figures S15-S19 and Methods S3, S5 for more details on assay methods and results. Scale bars, 10 nm in images, 20 nm in insets in (d), 2 nm in (e).

