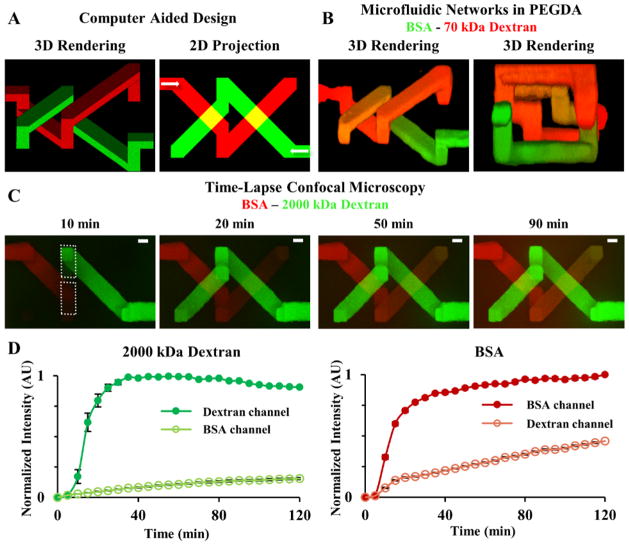
Figure 4. Transport Between 3D Intertwining Microchannels.
(A) A 3D model containing two independent yet intertwining microchannels (20×20 μm: x,y) was designed in SolidWorks; the white arrows in the 2D projection indicate the flow direction. (B) The 3D model was used to fabricate two microfluidic networks in PEGDA and the microchannels were exposed to (red) 70 kDa dextran and (green) BSA. Orange in the 3D renderings indicates transport of the two fluorescent species from their respective microchannel, through the hydrogel, into the adjacent channel. (B: right panel) Looking down the central axis of the intertwining channels shows that the two networks come within 15 μm of each other but never directly connect. (C) Time-lapse confocal images of species movement show (green) 2000 kDa dextran and (red) BSA filling their respective microchannel and transport through the hydrogel into the adjacent channel. (D) White dotted boxes in (C) indicate where intensities of 2000 kDa dextran and BSA were measured over time. (D: left graph) Normalized intensity of 2000 kDa dextran in its own channel and diffusion into the BSA channel (D: right graph). Normalized intensity of BSA in its own channel and diffusion into the 2000 kDa channel. (C) SB=20 μm.

