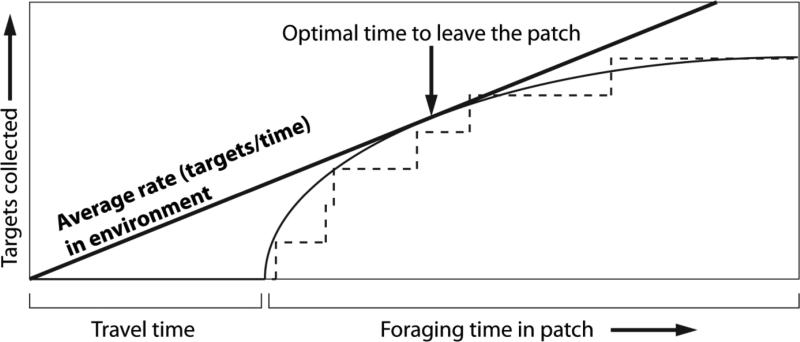
Figure 1.
Illustration of optimal foraging theory. The solid line represents an idealized forager's intake over time. During the “travel time” period, the forager is moving to the patch, and intake is zero. Once arriving in the patch (“foraging time”), intake increases rapidly at first, then gradually declines as the patch is exhausted. If the goal is to maximize rate of target collection, the optimal time to leave the patch is when the intake rate falls to the average in the environment (bold diagonal line); this is the point where the intake curve is tangent to the average rate. But a forager doesn't actually experience this solid-line curve while foraging in a single patch: instead, they collect discrete targets at random intervals, as represented by the dotted line. An optimal forager must infer the expected rate (solid line) and optimal leaving time from their experienced rate (dotted line) and expectations about the patch.

