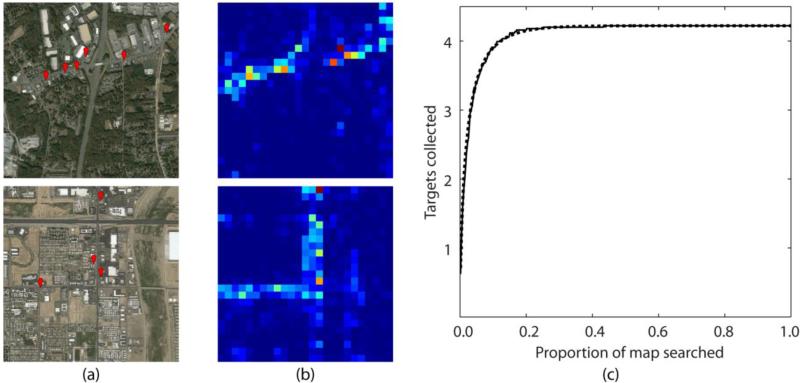
Figure 5.
Estimating the rate of target collection in the map search task. (a) Two example maps, red markers indicate gas stations. (b) Heatmaps showing the distribution of search clicks in these maps, averaged over all subjects. Pixels colored red are areas that were searched most frequently; dark blue areas were search least frequently. (c) Cumulative targets per area of the map searched, assuming search from most-frequent to least-frequent locations, averaged over maps with at least one target. The solid line is the empirical curve from the heatmaps in (b); the dotted line is the fitted curve used in modeling. Map imagery © Google, Digital Globe and Orbis, Inc.

