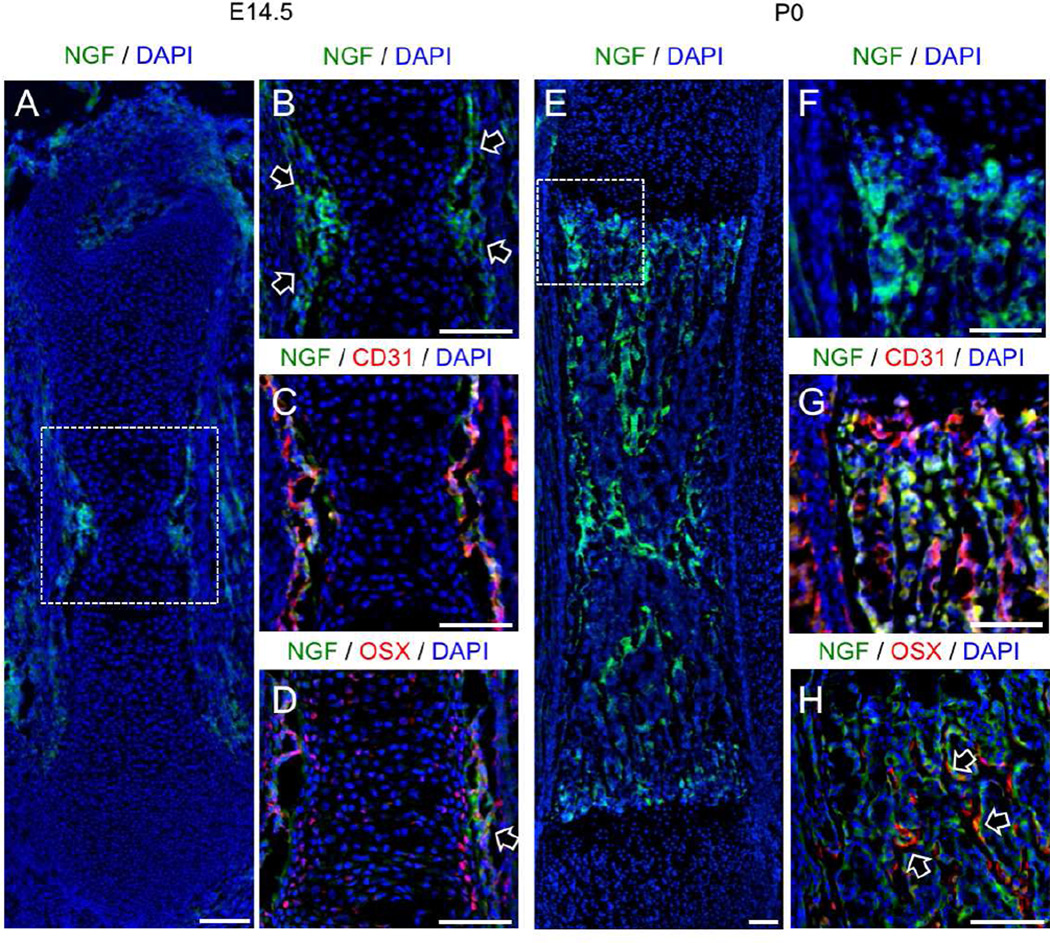
Figure 2. Localization of NGF expression in the developing mouse femur.
A) Femurs harvested from NGF-eGFP mice at E14.5 illustrate the expression of NGF at the perichondrial surface, with B) high powered inset showing NGF-expressing perichondrial cells (arrows) at the primary ossification center. C) Immunohistochemistry against CD31 illustrated that the primary ossification center is not yet vascularized. D) Immunohistochemistry against Osx marked some chondrocytes in the primary ossification center as well as perichondrial cells closely associated with NGF expression (arrow). E) Femurs harvested from NGF-eGFP mice at P0 illustrate the continued expression of NGF throughout the developing bone, with F) high powered inset at the growth plate. G) Immunohistochemistry against CD31 showed high vascularization but no correlation with NGF expression. H) Immunohistochemistry against Osx indicates close association of some Osx-expressing cells with NGF expression (arrows). Scale bars are 100 microns. See also Figure S1, S2, and S3.

