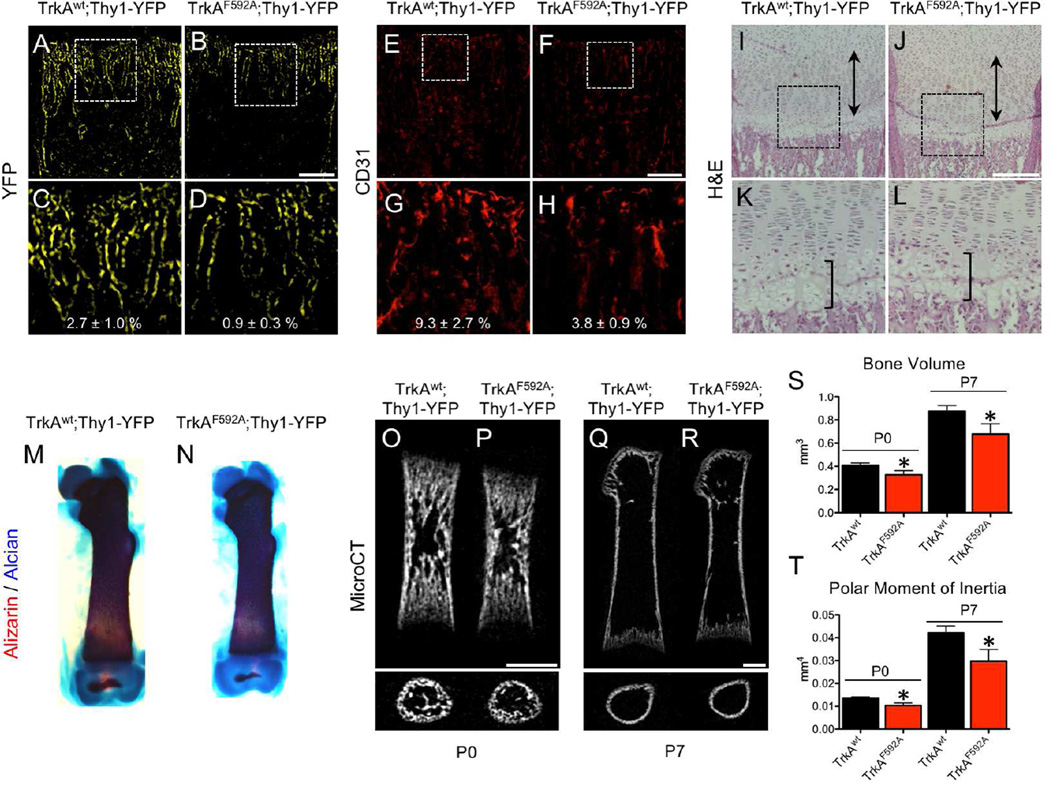
Figure 4. Inhibition of TrkA signaling impairs postnatal innervation, vascularization, and bone acquisition.
Nerves were visualized at the femoral metaphysis by Thy1-YFP expression in frozen sections from A) TrkAwt;Thy1-YFP and B) TrkAF592A;Thy1-YFP mice at postnatal day 7, with high powered insets (C,D). Blood vessels were visualized at the femoral metaphysis by immunohistochemistry against CD31 in frozen sections from E) TrkAwt;Thy1-YFP and F) TrkAF592A;Thy1-YFP mice at postnatal day 7, with high powered insets (G,H). H&E staining of I) TrkAwt;Thy1-YFP and J) TrkAF592A;Thy1-YFP mice at postnatal day 7 with hypertrophic zone (bracket) and proliferative zone (double arrow) marked, with high powered insets (K,L). Skeletal preparations of M) TrkAwt;Thy1-YFP and N) TrkAF592A;Thy1-YFP femurs at postnatal day 7. MicroCT analysis of TrkAwt;Thy1-YFP and TrkAF592A;Thy1-YFP mice at postnatal day 0 (O,P) and day 7 (Q,R) with quantification of S) bone volume and T) polar moment of inertia. * p < 0.05 by unpaired Student’s t-test. Scale bars are 100 microns. See also Figure S4, S5, and S7.

