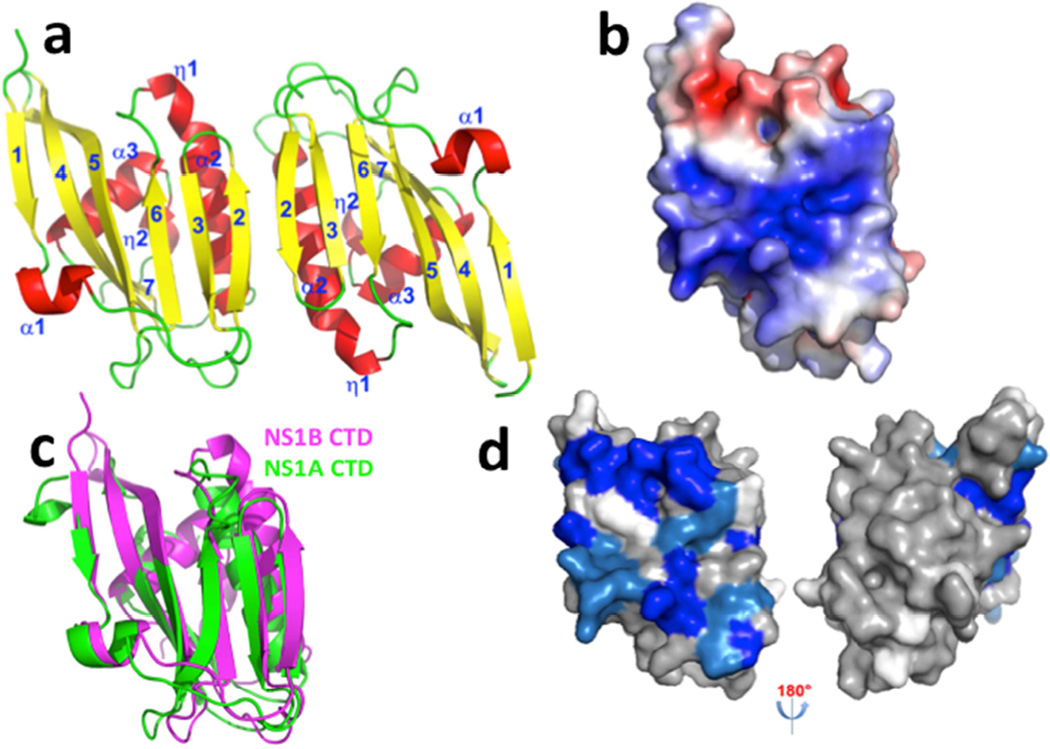
Fig. 1. The X-ray crystal structure of the CTD of NS1B protein reveals a broad basic surface.
(a) Ribbon diagram showing the 2.0-Å X-ray crystal structure of the dimeric NS1B CTD. β-strands are numbered 1 – 7, α-helices α1 – α3, and 310 helices as η1 – η2. (b) The electrostatic surface of the NS1B-CTD calculated with APBS plugin (Baker et al., 2001) of Pymol (DeLano, 2002) at ± 5 kT/e (red, negative; blue, positive). (c) The structure of NS1B CTD (magenta) superimposed on the structure of NS1A-CTD (green, PDB ID: 3EE9) (Xia and Robertus, 2010). (d) 15N-1H chemical shift perturbations Δδcomp due to dsRNA-binding mapped onto the 3D structure of the NS1B CTD. Residues with backbone 15N-1H CSPs due to dsRNA binding Δδcomp ≤ 20 ppb, 20 < Δδcomp < 30 ppb, and Δδcomp ≥ 30 ppb are highlighted in grey, lt. blue, and dk. blue, respectively (see Supplementary Figure S2). Residues for which CSPs could not be determined, including Pro residues, are shown in white. The molecular orientations in panels (a), (b), (c), and (d-left) are the same. Panel d also shows an orientation rotated by 180 deg, revealing no significant CSPs on the opposite side of the molecule.

