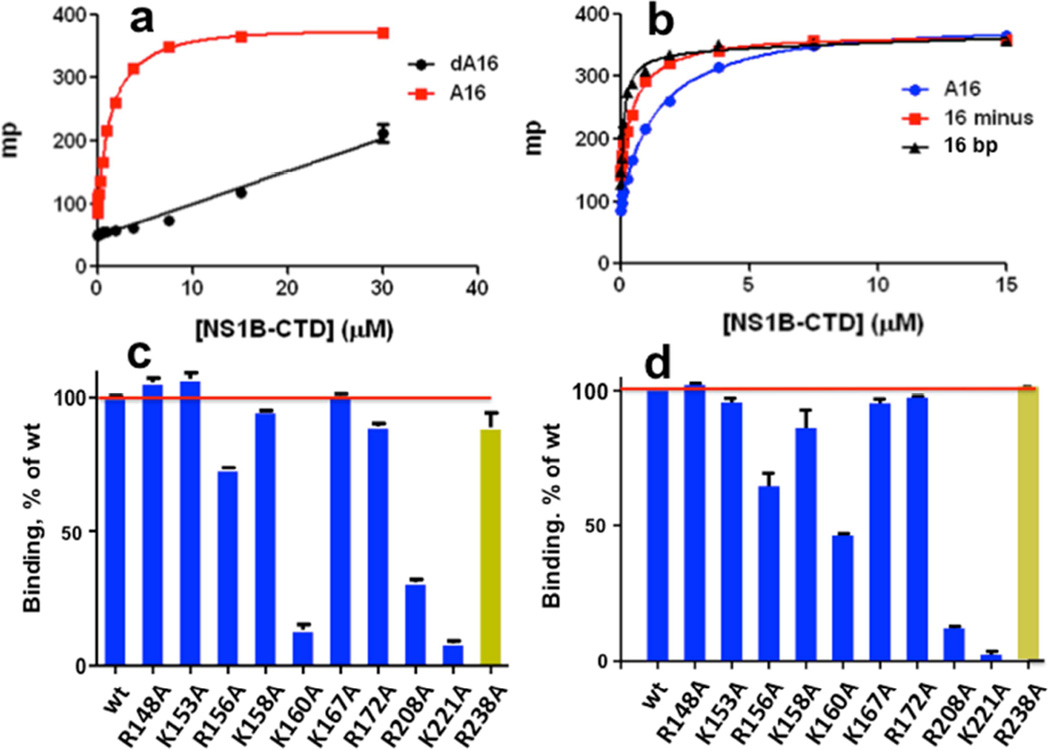
Fig. 2. Fluorescence polarization (FP) assays of nucleic acid binding activity.
FP, in units of millipolarization (mP), resulting from binding of fluorescein-labeled DNA and RNA molecules to NS1B-CTD. (a) Binding of poly-A16 ssRNA (A16, red) versus poly-dA16 ssDNA (dA16, black). (b) Binding of poly-A16 ssRNA (A16, blue), minus-strand of a 16-nt ssRNA (16 minus, red), and 16-bp dsRNA (16 bp, black). The effects of alanine replacements of individual Lys and Arg residues on the (c) ssRNA- and (d) dsRNA-binding activity of NS1B CTD, assayed by FP. The yellow histogram bar in each plot designates data for dimer-disrupting mutant R238A at the protein-protein interface formed at high protein concentrations and observed in the X-ray crystal structure.

