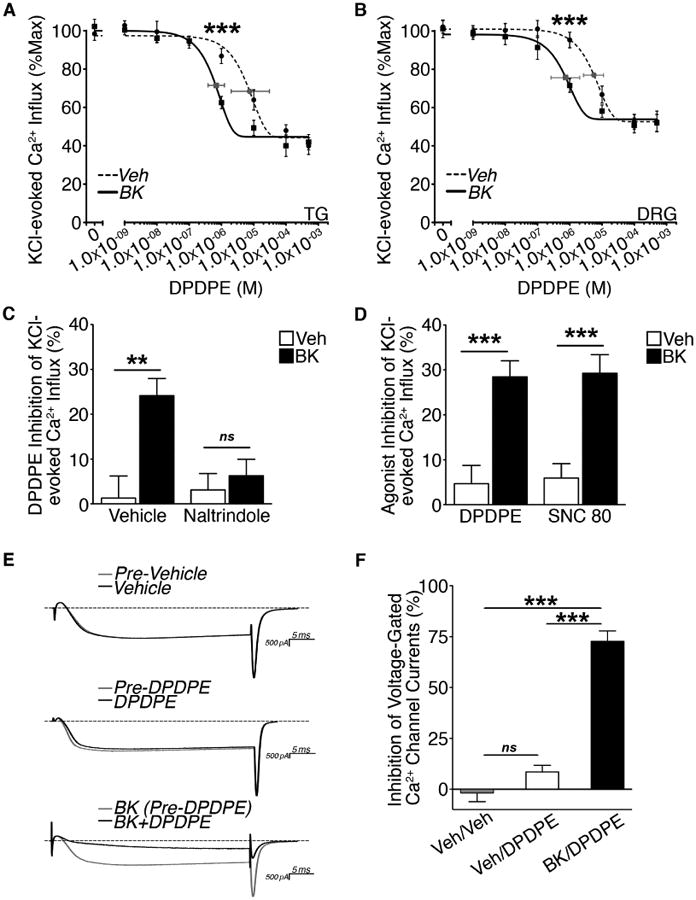
Figure 1. Functional DOR competence in sensory neurons.

(A and B) Dose response for DPDPE inhibition of KCl (50 mM)-evoked Ca2+ influx in (A) TG or (B) DRG pretreated with vehicle or BK (200 nM, 5 min) following 2 h serum-starvation (***p<0.005 vs. vehicle; A: n=26-57 and B: n=17-39 neurons/dose; two-way ANOVA Bonferroni post-hoc; mean ± SEM). Least squares fit (best-fit) variable slope curves used to determine IC50 for vehicle (dotted line) and BK (solid line) and 95% confidence intervals (grey).
(C) Effect of naltrindole pretreatment on DPDPE (1 μM) inhibition of KCl-evoked Ca2+ influx in DRG neurons pretreated vehicle or naltrindole (10 nM, 5 min) prior to vehicle or BK (200 nM, 5 min) treatment following 2 h serum-starvation (**p<0.01; ns = no significance; n=14-28 DRG/group; two-way ANOVA Bonferroni post-hoc; mean ± SEM).
(D) Comparison of DPDPE (1 μM) versus SNC 80 (1 μM) inhibition of KCl-evoked Ca2+ influx in DRG neurons pretreated with vehicle or BK (200 nM, 5 min) following 2 h serum-starvation(***p<0.005; n=24-34 DRG/group; two-way ANOVA Bonferroni post-hoc; mean ± SEM).
(E and F) (E) Representative traces and (F) quantification of DPDPE (1 μM) inhibition of VGCCs in DRG neurons (20-35 pF) pretreated with vehicle or BK (200 nM, 10 min) following 2 h serum-starvation (***p<0.005; n=4-9 DRG/group; one-way ANOVA Bonferroni post-hoc; mean ± SEM).
See also Figure S1-S2.
