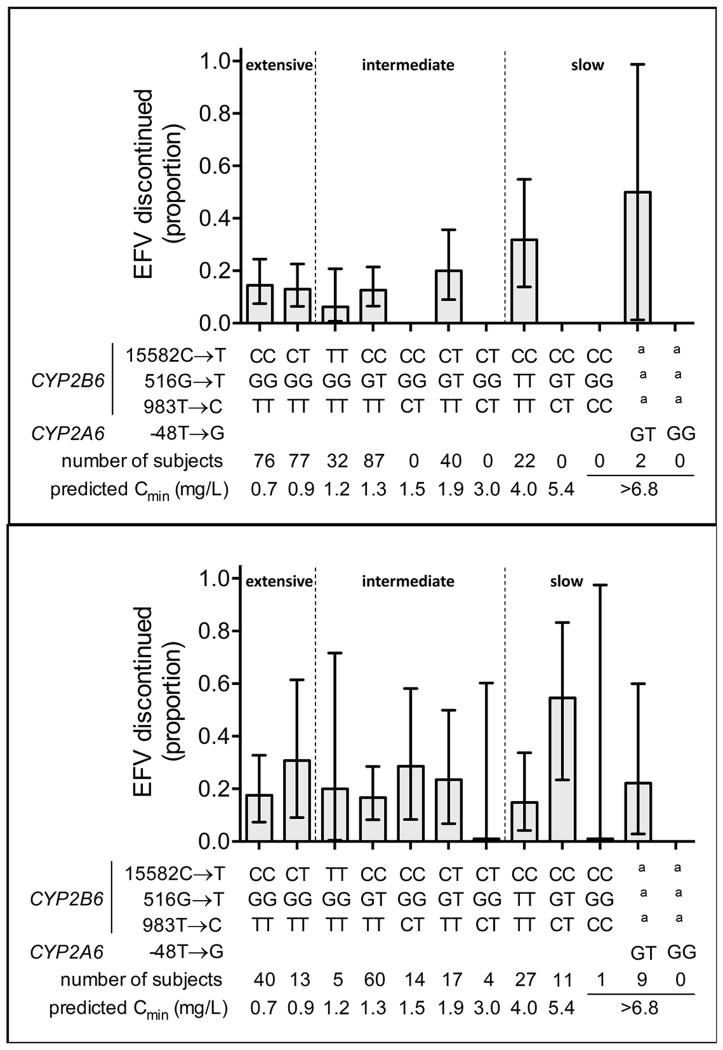
Figure 2. Proportions of patients who discontinued efavirenz within the first 12 months of therapy, stratified by composite CYP2B6/CYP2A6 genotype.
Graphs represent subjects who initiated efavirenz 600 mg once daily, had no change in their antiretroviral therapy regimen before week 48, and had HIV-1 RNA data available at both week 0 and week 48. Panel A: Self-identified White participants. Panel B: Self-identified Black participants. The 12 strata are defined by CYP2B6 15582C→T, 516G→T, 983T→C, and CYP2A6 −48T→G as indicated. Plasma efavirenz concentrations were not measured in the present study. Predicted median efavirenz Cmin concentrations are from the study by Holzinger et al, in which median plasma efavirenz exposure within each genotype stratum were very similar among Blacks and Whites [15]. Error bars represent 95% confidence intervals by the modified Wald method. a Indicates that the CYP2A6 polymorphism is present together with any of the 3 CYP2B6 strata furthest to the right. The top of each indicated relationships between metabolizer groups (extensive, intermediate, and slow) and the 12 genotype categories.

