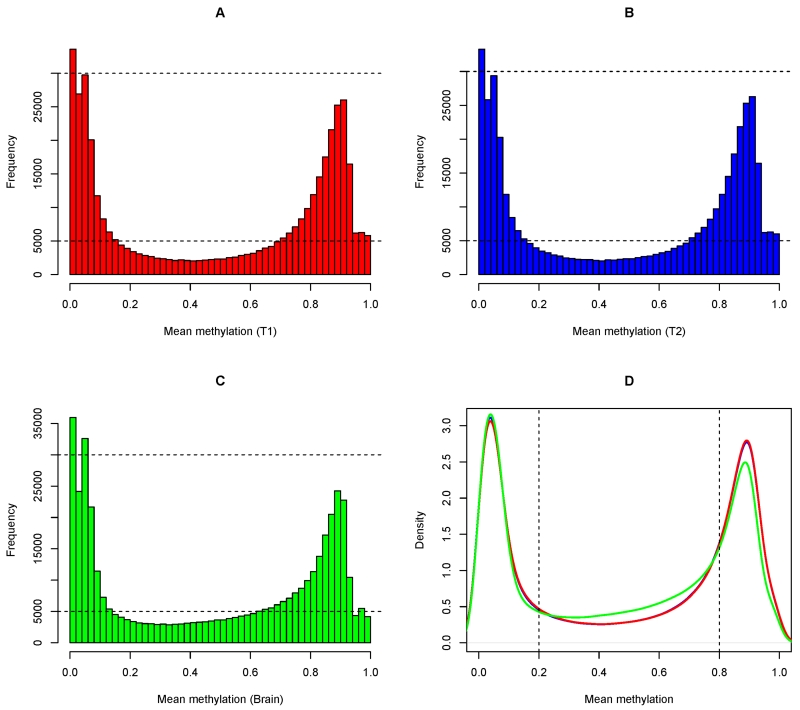
Figure 1.
illustrates the global distribution of DNA methylation for T1 CD4+ lymphocytes (Panel A), T2 CD4+ lymphocytes (Panel B), and brain (Panel C). Each panel (A, B and C) shows the histogram of methylation of 420,132 autosomal CpG sites, which were averaged across 41 subjects. Panel D shows the density distributions of T1, T2, and brain, overlaying each other.

