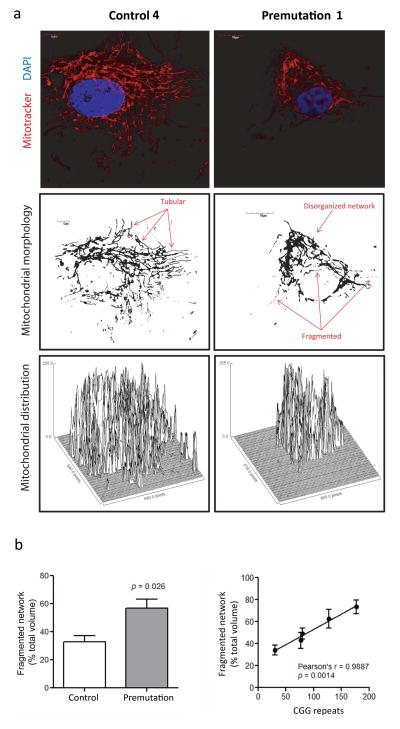
Figure 3. Morphological analysis and mitochondrial distribution in fibroblasts from controls, premutation and FXTAS.
Slides for confocal analysis were prepared and stained as described in the Methods section. Image acquisition was performed with an Olympus FV1000 laser scanning confocal microscope with 60X magnification and zoom values between 3 and 4. Images show fibroblasts obtained by control (Control #4 in Table 1), and a premutation (Premutation #2 in Table 1). Representative images of all control and premutation cell lines used for the morphological analysis are shown in Supplementary Figure 1. (a) Top panels show mitochondria stained with Mitotracker Red CMXRos (red) and nuclei stained with DAPI (blue). Mid panels show mitochondria morphology and distribution. Image was obtained with the ImageJ software discarding the color information and adjusting the threshold to minimize the background level. Images show a more disorganized mitochondrial network in cells from premutation individuals, with an increased in fragmented/circular mitochondria and decreased tubular network in FXTAS cells. Bottom panels show surface plots obtained with the ImageJ software and display the perinuclear mitochondrial distribution observed in cells from premutation and FXTAS, compared to a more uniform cellular distribution in controls. (b) A statistically significant difference was observed in the percentage of disrupted/fragmented mitochondrial network in fibroblasts from premutation (n = 4) relative to control (n = 4). Statistical analysis was performed by using Student’s t test. The presence of a strong direct correlation between CGG repeat number and degree of the mitochondrial network disruption was also noted. At least 10 cells per line were imaged and analyzed with the Fiji’s MitoMap plugin. Relative volumes (Vs) were calculated as described in [19]. Objects with Vs ≤ 20% of total cellular Vs were considered fragmented.

