
Figure 5. GABAA receptors containing mutant βsubunits identified in LGS patients reduced GABA potency or efficacy.
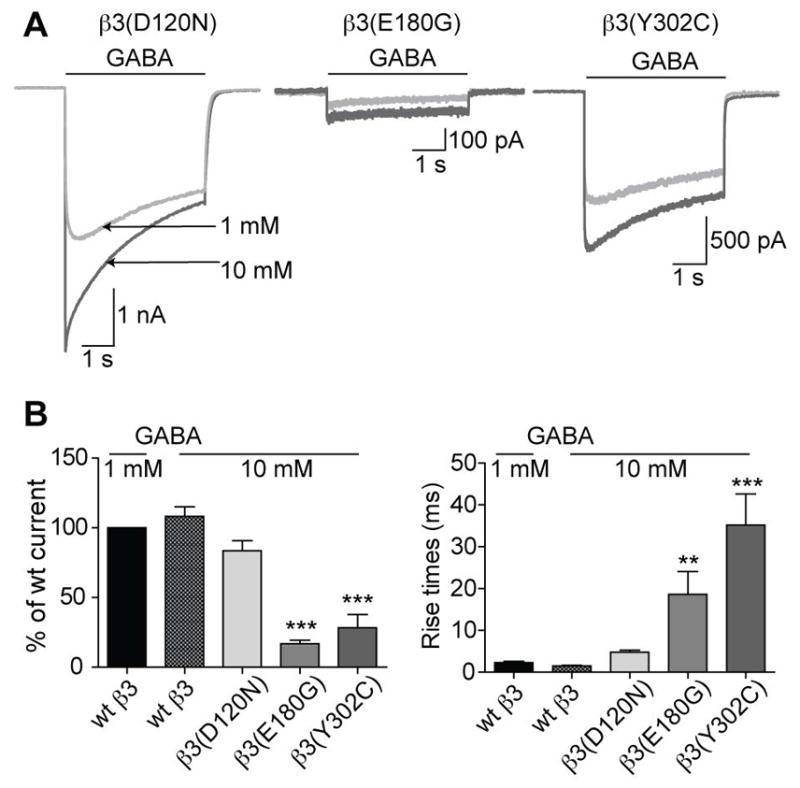
(A) Representative whole cell current responses following GABA application from cells expressing wt or mutant receptors (hom condition). The current traces with 1 mM GABA application (light grey) were overlaid with current traces with 10 mM GABA application (dark grey). (B, left) Bar graphs show average peak current responses to 10 mM GABA application as % of wt response to 1 mM GABA. 10 mM GABA-evoked currents from β3(D120N), β3(E180G), and β3(Y302C) subunit-containing receptors were 83.6 ± 7.3%, 16.9 ± 2.5%, and 28.3 ± 9.6% of the wt current, respectively, with 1 mM GABA. (B, right) Bar graphs show the average rise times of GABA-evoked currents to 1 and 10 mM GABA application from cells with wt or hom expression. Rise times for β3(D120N), β3(E180G), and (β3(Y302C) subunit-containing receptors were 4.8 ± 0.5 ms, 18.6 ± 5.5 ms, and 35.2 ± 7.4 ms, respectively. Values were expressed as mean ± SEM. One-way ANOVA with Dunnett’s post-test was used to determine significance. * represents significant difference compared to the wt condition with 1 mM GABA application, * = p < 0.05, ** = p < 0.001, *** = p < 0.0001.