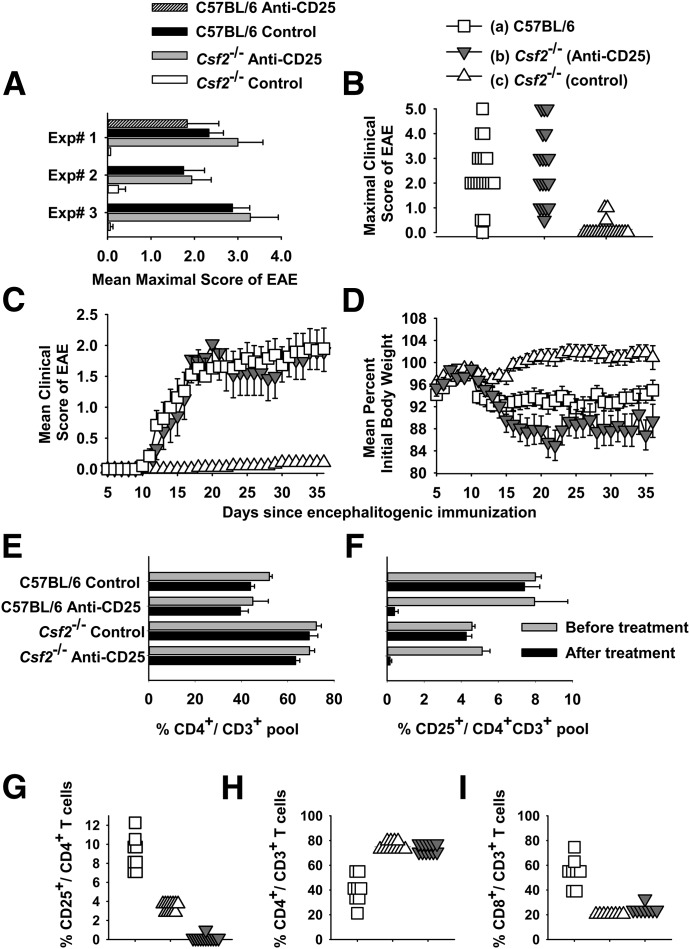
Figure 1. The PC61 anti-CD25 mAb enables the active induction of EAE in Csf2−/− mice.
(A–I) C57BL/6 or Csf2−/− mice were or were not pretreated with 250 µg purified PC61 mAb on d −4 and −2 i.p. (A–D) Shown are individual (A) or pooled (B–D) data from Experiments 1–3 of Table 1. Mice were immunized with 200 µg MOG35–55 in CFA subcutaneously on d 0 and injected with Ptx (200 ng) i.p. on days 0 and 2. (A) Mean maximal scores (±sem) are shown for Experiments 1–3 (Csf2−/− with and without PC61, P < 0.02 for all 3 experiments). (B) Frequency analysis of the mean maximal scores are shown for data pooled from Experiments 1–3 for WT mice (n = 19), Csf2−/− mice treated with PC61 (n = 18), and Csf2−/− control mice [n = 19; (c) vs. (b) and (a), P < 0.001]. This description also applies to C and D and G–I. (C and D) The daily mean maximal scores and weight loss are shown for data pooled from Experiments 1–3. Daily mean clinical scores for (a) vs. (c) (d 12 and 13, P < 0.005; d 14–36, P < 0.001) and (b) vs. (c) (d 15 and 16, P < 0.05; d 17–36, P < 0.001) were assessed by nonparametric ANOVA. Daily body weight values for (a) vs. (c) (d 11–13 and d 16–36, P < 0.05) and (b) vs. (c) (d 15, P = 0.008; d 16–36, P < 0.005) were assessed by parametric ANOVA. (E and F) C57BL/6 CD4+ and CD25+ percentages vs. Csf2−/− CD4+ and CD25+ percentages (analyzed groups that were not treated with PC61, P < 0.001). (F) C57BL/6-PC61 and Csf2−/−-PC61 groups on d −4 before treatment vs. d 0 after treatment (n = 3, P < 0.01). (G) All comparisons, P < 0.001. (H and I) (a) vs. (b) and (c), P < 0.001.

