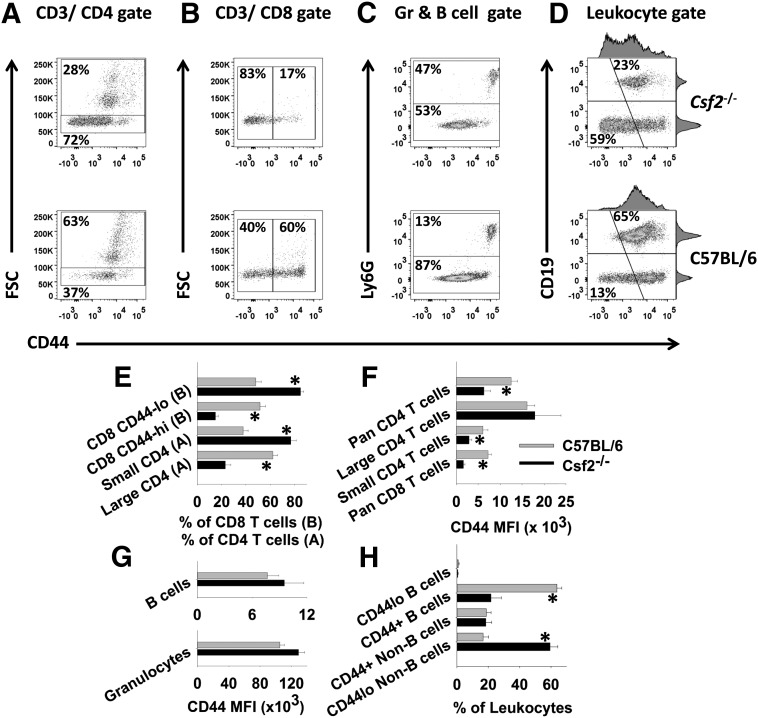
Figure 5. Csf2−/− mice show altered T cell expression of CD44.
PBMCs from 6 Csf2−/− and 6 C57BL/6 were stained with fluorochrome-conjugated antibodies against CD45, CD3, CD4, CD8, CD44, Ly-6G, or CD19. Dot plots (upper) show data from a representative mouse from each group, and the associated bar graphs (lower) show the means and sd of each group (n = 6 mice). Gated populations of CD3+CD4+ T cells (A, E, and F) and CD3+CD8+ T cells (B, E, and F) were analyzed for FSC and CD44 expression. (C and G) A granulocyte (Gr)–B cell gate was used to analyze CD44 levels on the respective subsets. (D and H) A leukocyte gate (excluding granulocytes) was used to analyze CD44 expression on B cells and non-B cells (mostly T cells). The bar graphs show the mean percentage of the designated subsets (E and H) or the MFI for CD44 expression (F and G) together with the sd (*P < 0.001). These data are representative of 4 independent experiments.

