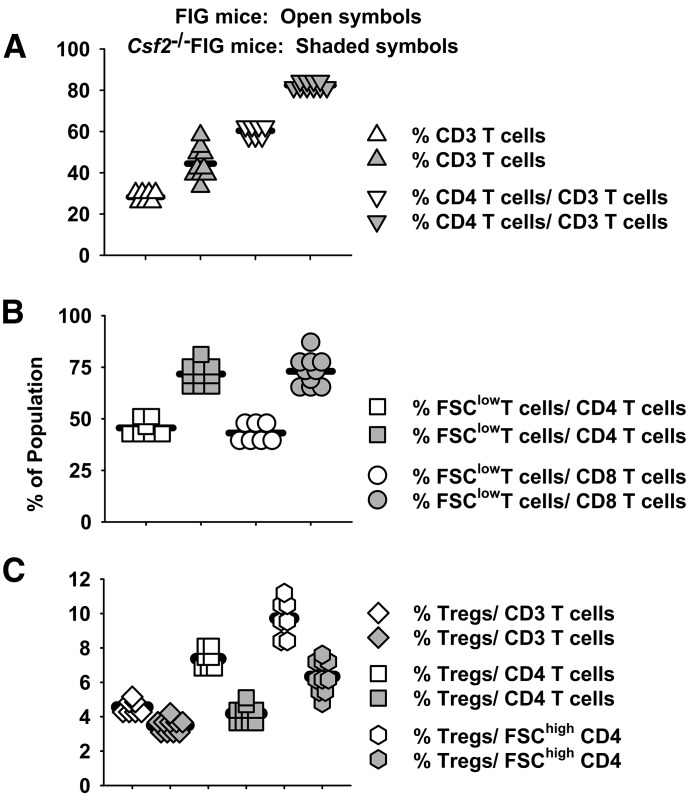
Figure 6. Percentages of CD4+ CD25+ FOXP3+ Tregs in Csf2−/− exhibit modest reductions in frequency relative to the pool of total CD3+ T cell.
PBMCs were obtained from 7 Csf2−/− FIG mice and 10 FIG mice. (A) Shown are the percentages of CD3+ T cells among total leukocytes (excluding granulocytes) and the percentage of CD4+ T cells among the total CD3+ T cell pool. (B) Shown are the percentages of FSClow CD4+ T cells among the total CD4+ T cell pool and the percentages of FSClow CD8+ T cells among the total CD8+ T cell pool. (C) Shown are the percentages of CD4+ CD25+ FOXP3+ Tregs among the CD3+ T cell pool, the CD3+ CD4+ T cell pool, and the FSChigh CD3+ CD4+ T cell pool. t Tests revealed significant differences for all 7 pairwise comparisons (A–C; P < 0.001). These data are representative of 3 independent experiments.

