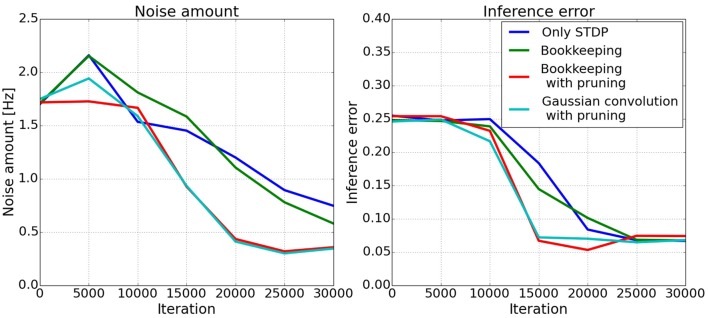
Figure 8.
Development of inferred responses in population C. The left plot shows the amount of noise onoise in the spiking activity in population C of the three-way network. The two algorithms using pruning decrease the amount of noise faster. The right plot shows the error of the inference. The error is calculated as the difference of the mean of the spiking activity in C and the target value A + B. Clearly visible is the faster convergence of the bookkeeping with pruning and the Gaussian convolution algorithm.

