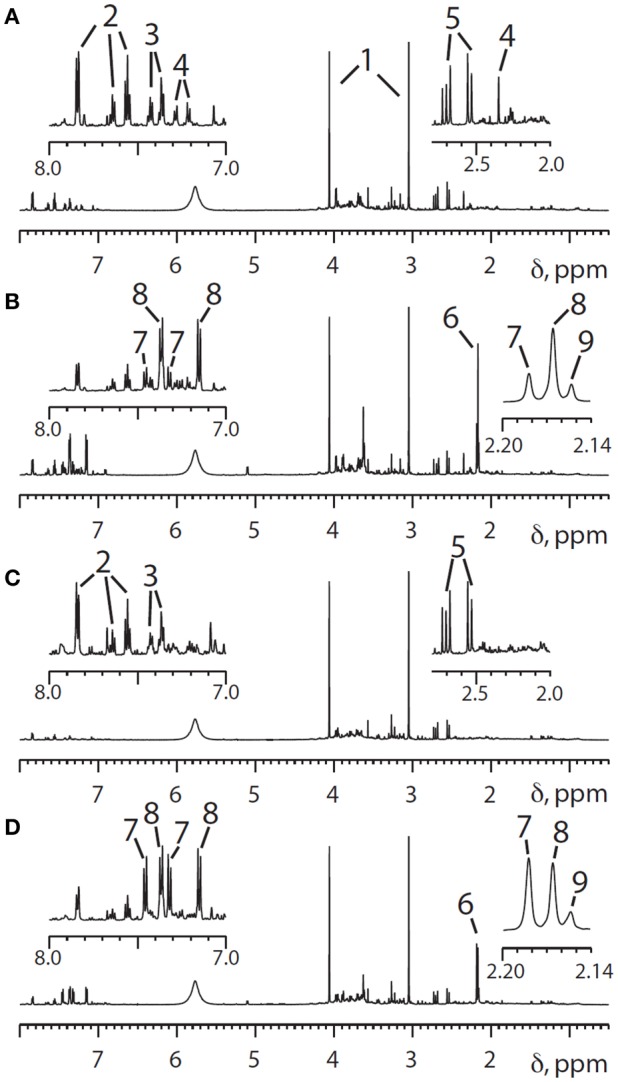
Figure 3.

600 MHz 1H NMR spectra of the urine from two different human volunteers in the region from 0.5 to 8.0 ppm, with expansion of the aromatic proton region (7.0–8.0 ppm) and a higher field region (2.0–2.8) shown above. (A) Pre-dose urine from volunteer 1; (B) 0–3 h post-dose NMR spectra from volunteer 1, The main differences between the pre-dose and post-dose spectra are the appearance of signals from paracetamol and its metabolites in both the aromatic and acetyl regions. (C,D) Corresponding pre- and post-dose spectra for volunteer 2. Key to peak numbers: 1, creatinine; 2, hippurate; 3, phenylacetylglutamine; 4, metabolite 4 (unknown at the time: see text); 5, citrate; 6, cluster of N-acetyl groups from paracetamol-related compounds; 7, paracetamol sulfate; 8, paracetamol glucuronide; 9, other paracetamol-related compounds. Reproduced from PNAS (Clayton et al., 2009).
