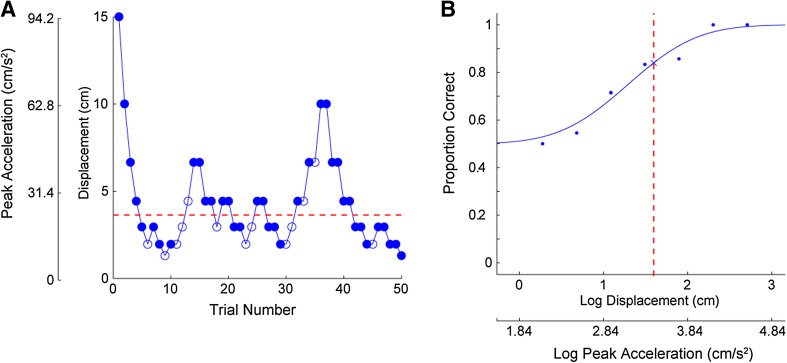
Fig. 1.
Example of individual staircase history (a) and psychometric fit (b). The 2D1U staircase terminated after 50 trials. Filled and unfilled points show correct and incorrect responses, respectively. b Cumulative Gaussian fit to data from (a). Proportion of correct responses is plotted as a function of the log of the stimulus magnitude. Threshold is the stimulus value corresponding to 84 % correct shown by red dashed lines in a and b

