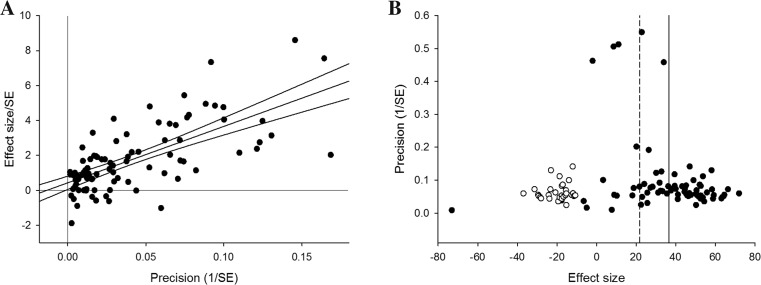
Fig. 4.
Publication bias in infarct volume estimates assessed by a Egger’s regression, showing regression line with 95 % CI, and b trim and fill analysis, showing the distribution of published study outcomes (filled circles) and imputed outcomes (unfilled circles). The solid vertical line represents the global estimate of efficacy and the dashed line the adjusted reduction in infarct volume when theoretically missing studies are incorporated

