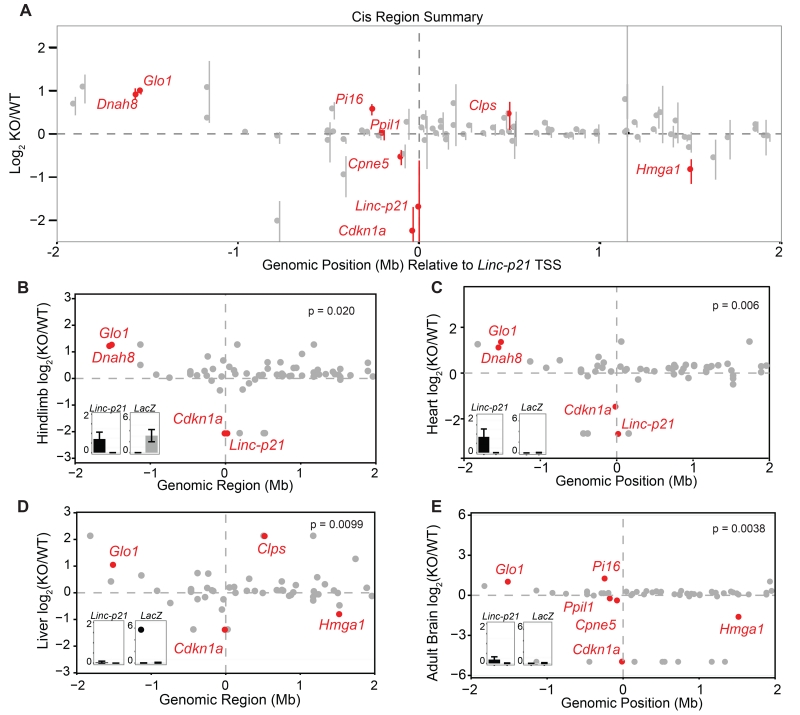
Figure 2. Linc-p21 transcript is not required for local gene regulation.
(A) Summary of local transcriptional changes upon Linc-p21 deletion (+/− 2Mb of Linc-p21). Dots represent average log2 fold change across all 6 tissues and error bars represent standard error. Red indicates significant differential expression in at least one tissue. (B-E) Expression of genes in local region (+/− 2Mb of Linc-p21) for E14.5 hindlimbs (B), heart (C), liver (D), and adult brain (E). In each plot, the Y-axis represents the log2 FPKM fold change and genes marked in red were significantly differentially expressed. The p value represents the probability that this number of genes would be differentially expressed within a region of this size. Insets show Linc-p21 and lacZ expression (FPKM) in wildtype (black) and knockout (gray). See also Figure S2.

