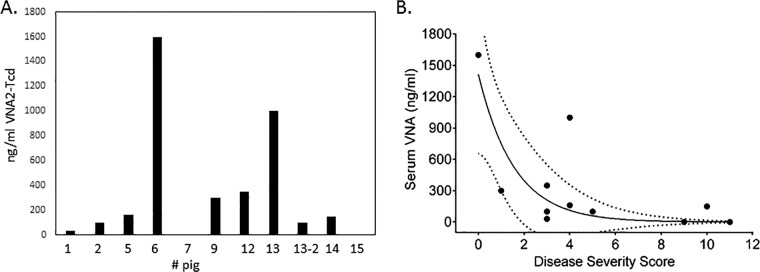
FIG 7.
Ad/VNA2-Tcd detection in serum and disease correlation. (A) VNA2-Tcd levels detected in pig serum by ELISA using 0.5 μg/ml of TcdA or TcdB and serum diluted 1:10. Samples 7 and 15 correspond to control animals (unrelated Ad/VNA-treated piglets), and the remaining samples correspond to Ad/VNA2-Tcd-treated piglets. (B) CDI severity versus serum VNA concentration in pigs treated with Ad/VNA2-Tcd, assessed with Spearman's rank correlation (rS = −0.614; P = 0.04433). The dashed lines show the 95% confidence interval.

