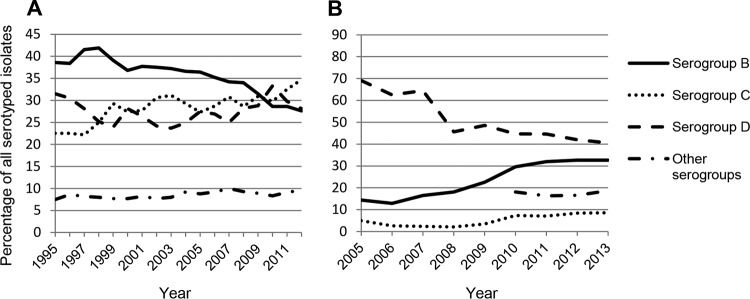
FIG 1.
Frequency of nontyphoidal Salmonella serogroups associated with human infections, by year. (A) NTS serovars in the United States from 1995 to 2012. (B) NTS serovars in Europe from 2005 to 2013. Data were obtained from the U.S. Centers for Disease Control and Prevention and the European Surveillance System (TESSy).

