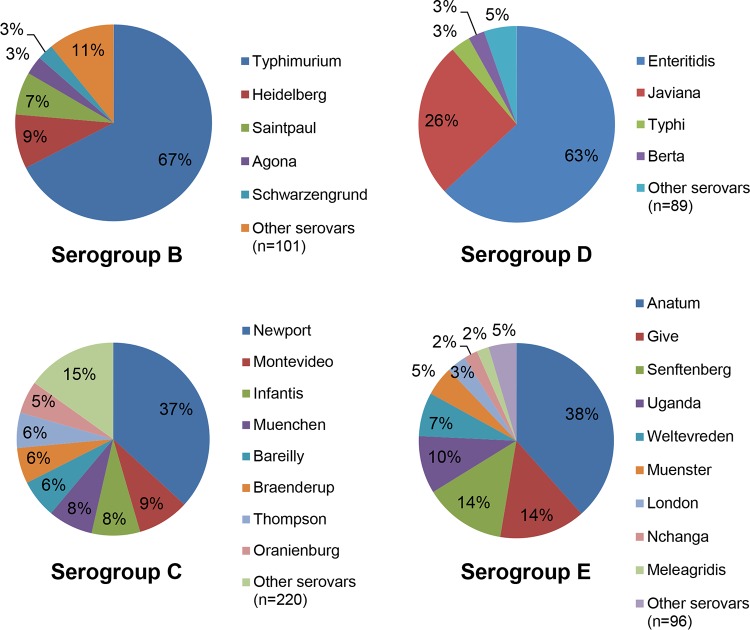
FIG 5.
Contribution of individual serovars within serogroups isolated in the United States in 2012. Only serovars responsible for 2% or more of cases within each serogroup are represented individually. In 2012 in the United States, serovar I 4,[5],12:i:− accounted for 15.8% of all cases associated with serogroup B NTS. These data are included within the S. Typhimurium slice of the pie chart. Data are from the U.S. Centers for Disease Control and Prevention.

