
Figure 7.
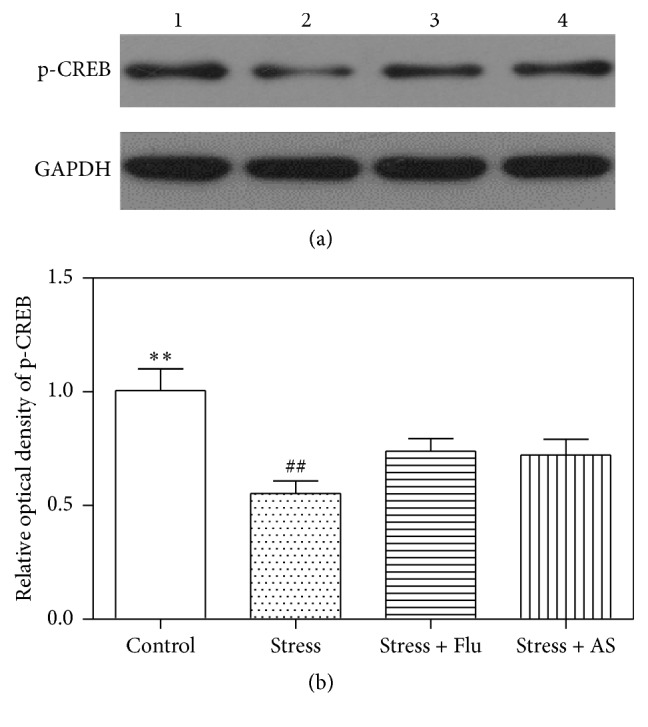
Effects of AS on CUMS induced depression on CREB phosphorylation protein expression in hippocampus. (a) Western blot band. Band 1: control; Band 2: stress; Band 3: stress + fluoxetine; Band 4: stress + AS. (b) Relative optical density of p-CREB in the 4 groups. Values were expressed as mean ± SD (n = 6). ∗∗ p < 0.01 compared with fluoxetine group and AS group. ## p < 0.01 compared with fluoxetine group and AS group.