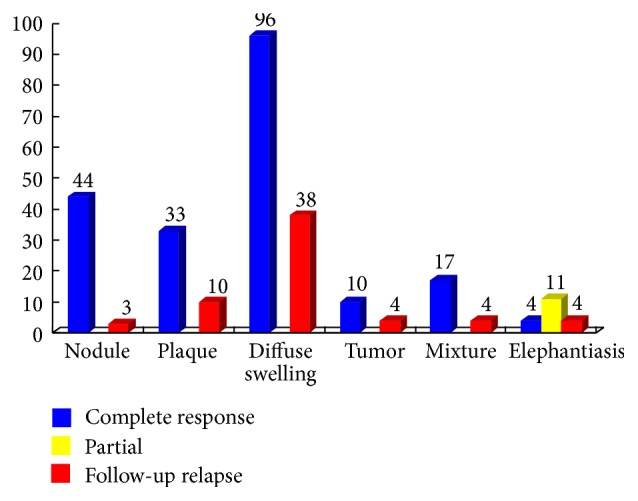
Figure 13.

Clinical outcome of 215 cases with PTM after therapy and in the 1.5-year follow-up. After diagnosed at our department, 215 cases received therapy and underwent 1.5-year follow-up after therapy. The numbers above the color rectangles represented the case numbers of 6 variants, respectively. In 6 variants, blue rectangles indicated the case numbers of complete response to therapy; yellow rectangles showed the case numbers of partial response to therapy and red rectangles indicated the case numbers of relapse after therapy in the 1.5-year follow-up.
