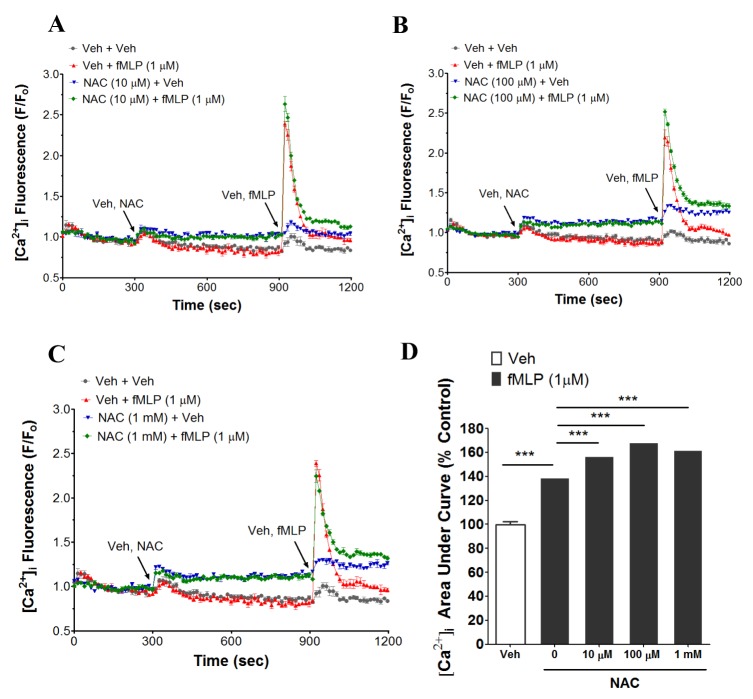
Fig. 2. Effects of NAC and cysteine on fMLP-induced increase in [Ca2+]i in human neutrophils.
Vehicle or NAC at 10 µM, 100 µM and 1 mM (A~C), and fMLP (1 µM) were added at the time points indicated by the arrowheads. Changes in [Ca2+]i were expressed as the relative fluorescence intensity of Fluo-3 AM over baseline fluorescence intensity (F/F0). (D) [Ca2+]i following treatment of vehicle or fMLP (1 µM) was shown as area under curve (AUC), which was calculated for 300 s (900~1200 s) and was expressed as percentage control (% control). Data were analyzed by Graphpad Prism 5.0 (Graphpad software) using ANOVA. Bonferroni test was used for post-hoc comparison. An average of three independent experiments is shown. ***p<0.001.

