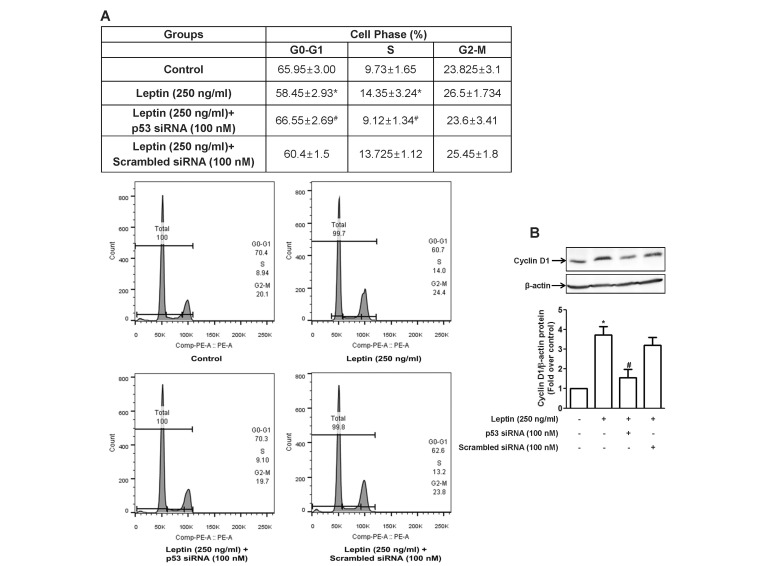
Fig. 6. Role of p53 signaling in leptin-induced cell cycle progression in HepG2 cells.
Cells were transfected with siRNA targeting p53 or scrambled control siRNA followed by incubation with indicated concentration of leptin for 48 h. (A) Cell cycle was analyzed using flow cytometer as described in materials and methods. (Upper panel) Values are the percentage of the cells in each of the cell cycle phases and are expressed as mean±SEM (n=5). (Lower panel) Images are the representative image of the five independent experiments which showed similar results. (B) Cyclin D1 protein expression level was determined by Western blot analysis. (Upper panel) Representative images of three independent experiments are shown along with β-actin for internal loading control. (Lower panel) Quantitative analysis of p53 protein expression was performed by densitometric analysis and presented as mean±SEM (n=3). *p<0.05 compared to the control cells; #p<0.05 compared to the cells treated with leptin, but not transfected with siRNA.

