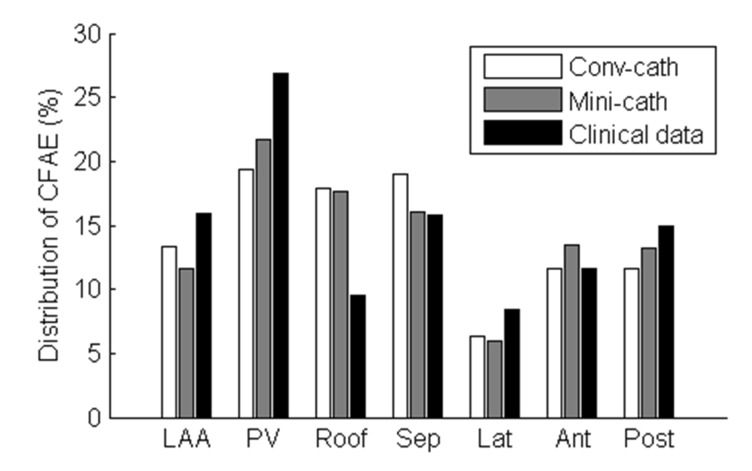
Fig. 6. Regional distribution of the CFAE area in the virtual CFAE map and the clinical CFAE map.
The distribution of the consistent CFAE sites (CFAE-CL<120 ms) was calculated. LAA, left atrial appendage; PV, pulmonary veins; Roof, roof wall; Sep, septal wall; Lat, lateral wall; Ant, anterior wall; Post, posterior wall.

