Abstract
Recombination presents a nonuniform distribution across the genome. Genomic regions that present relatively higher frequencies of recombination are called hotspots while those with relatively lower frequencies of recombination are recombination coldspots. Therefore, the identification of hotspots/coldspots could provide useful information for the study of the mechanism of recombination. In this study, a new computational predictor called SVM-EL was proposed to identify hotspots/coldspots across the yeast genome. It combined Support Vector Machines (SVMs) and Ensemble Learning (EL) based on three features including basic kmer (Kmer), dinucleotide-based auto-cross covariance (DACC), and pseudo dinucleotide composition (PseDNC). These features are able to incorporate the nucleic acid composition and their order information into the predictor. The proposed SVM-EL achieves an accuracy of 82.89% on a widely used benchmark dataset, which outperforms some related methods.
1. Introduction
Meiotic recombination describes the process of alleles' exchange between homologous chromosomes during meiosis [1]. It can provide material for natural selection by producing diverse gametes. It might also contribute to the evolution of the genome via gene conversion or mutagenesis [2–4].
Although the exact location where recombination happens in the genome and the mechanism of recombination are still unclear, it has been assured that recombination plays an important role in promoting genome evolution. Therefore, several studies have been performed on chromosomes [5–7] and found that recombination presents a nonuniform distribution across the genome. Genomic regions that present relatively higher frequencies of recombination are called hotspots while those with relatively lower frequencies of recombination are called recombination coldspots [8, 9]. With the number of the sequenced genomes showing explosive growth, more reliable methods are urgently needed to be developed to identify the recombination spots.
The prediction of recombination hotspots or coldspots is still a challenging task, although much information can be acquired from the experiments. Recently, several computational models have been presented to identify the recombination hotspots/coldspots. For example, Liu et al. [10], based on sequence Kmer frequencies, proposed a model which combines the increment of diversity with quadratic discriminant analysis (IDQD). Later, this method was improved by adding gaps into the kmers [11]. Chen et al. presented a predictor called iRSpot-PseDNC trained with pseudo dinucleotide composition features [12].
The aforementioned methods extracted the features from DNA sequences in different aspects. For example, the model based on oligonucleotide frequencies considers the nucleic acid composition information. The iRSpot-PseDNC incorporates both the local nucleic acid composition information and the global information of the protein sequences. Therefore, it is reasonable to combine these complementary predictors to further improve the performance of recombination hotspot/coldspot identification. In this regard, three basic predictors trained with basic kmer (Kmer) [13], dinucleotide-based auto-cross covariance (DACC) [14, 15], and pseudo dinucleotide composition (PseDNC) [16], respectively, were combined via the framework of ensemble learning approach, and a novel predictor called SVM-EL was proposed. All these features can be easily generated by a recently proposed tool called Pse-in-One [17], which is able to generate various features only based on the DNA, RNA, or protein sequence information.
2. Materials and Methods
2.1. Benchmark Dataset
The benchmark datasets S was obtained from Liu et al. [10]:
| (1) |
where the subset S + contains 490 recombination hotspots, the subset S − contains 591 recombination coldspots, and the symbol ∪ represents the “union” in the set theory.
2.2. Feature Vectors Generated by Pse-in-One
SVM-EL is developed by combining the outcomes of three individual predictors which were trained by different features, including basic kmer (Kmer) [13], dinucleotide-based auto-cross covariance (DACC) [14, 15], and pseudo dinucleotide composition (PseDNC). These basic features can be generated by using Pse-in-One [17] which provides two approaches to generate feature vectors. One way is through the web server (http://bioinformatics.hitsz.edu.cn/Pse-in-One/) and another way is through the stand-alone tool (http://bioinformatics.hitsz.edu.cn/Pse-in-One/download/).
Suppose a DNA sequence D is
| (2) |
where L represents the DNA sequence length and R i (i = 1,2 ⋯ L) is the nucleic acid at the position i. Therefore, three basic features used in the current study can be described as follows.
2.2.1. Kmer
Kmer [13] is an approach representing DNA sequences by the occurrence frequencies of kmers. The Kmer contains the local sequence-order information and it can be generated with the help of Pse-in-One by the following steps.
For web server approach, firstly, choose DNA sequences (PseDAC-General), then select Kmer in the tab of Mode, and set the value of k. Secondly, input or upload the DNA sequence file in FASTA format, click the Submit button, and then you will see the results and you can download them as a text file (Figure 1).
Figure 1.
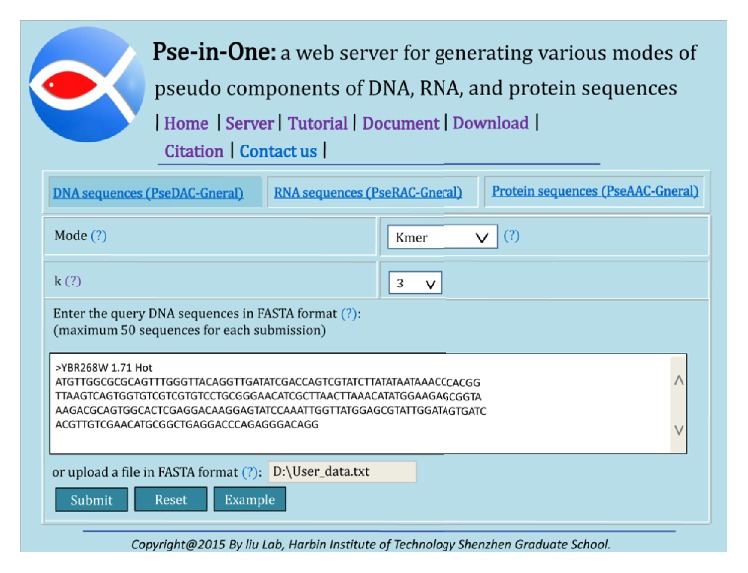
An example of the kmer features' generation by using Pse-in-One.
For stand-alone approach, Kmer features can be easily generated by using the following command line:
-
‘./kmer.py −f svm −l +1 3 DNA'
where −f svm represents the format of the output file which is the LIBSVM training data format, −l +1 represents the input file that contains positive samples only, k equals 3, and the sequence type is DNA.
2.2.2. Dinucleotide-Based Auto-Cross Covariance (DACC)
Dinucleotide-based auto-cross covariance (DACC) [14, 15] is the combination of DAC [14, 15, 19] and DCC [14, 15]. The DAC measures the correlation between two dinucleotides for one DNA property [17]. The DCC approach measures the correlation between two dinucleotides for two different properties [17].
Given a DNA sequence D represented as (2), the DAC feature can be calculated as [17]
| (3) |
where μ is the dinucleotide property index; L is the length of DNA sequence; lag represents the distance between two dinucleotides; P μ(R i R i+1) represents the value of dinucleotide R i R i+1 at position i for the dinucleotide property index μ; represents the average value of P μ(R i R i+1) for a DNA sequence.
Given a DNA sequence D represented as (2), the DCC feature can be calculated as [17]
| (4) |
where μ 1 and μ 2 are two different dinucleotide property indices; L is the DNA sequence length; lag is the distance between two dinucleotides; P μ1(R i R i+1)(P μ2(R i R i+1)) represents the value of dinucleotide R i R i+1 at position i for the dinucleotide property index μ 1(μ 2); represents the average value of P μ1(R i R i+1)(P μ2(R i R i+1)) for a DNA sequence.
The features of DACC contain global sequence-order information, and it can be generated via Pse-in-One [17] which includes two generation approaches. The generation steps of DACC feature can be described as follows.
For web server approach, firstly, choose the DNA sequences (PseDAC-General) option, then select DACC in the tab of Mode, and set the value of lag. Secondly, upload a user-defined physicochemical index file called user_property and the values of fifteen dinucleotide physicochemical properties are shown in Table 1. Finally, input or upload the DNA sequence file in FASTA format, click the Submit button, and then you will see the results and you can download them as a text file (Figure 2).
Table 1.
The values of fifteen DNA dinucleotide properties.
| AA/TT | AC/GT | AG/CT | AT | CA/TG | CC/GG | CG | GA/TC | GC | TA | |
|---|---|---|---|---|---|---|---|---|---|---|
| F-roll | 0.04 | 0.06 | 0.04 | 0.05 | 0.04 | 0.04 | 0.04 | 0.05 | 0.05 | 0.03 |
| F-tilt | 0.08 | 0.07 | 0.06 | 0.10 | 0.06 | 0.06 | 0.06 | 0.07 | 0.07 | 0.07 |
| F-twist | 0.07 | 0.06 | 0.05 | 0.07 | 0.05 | 0.06 | 0.05 | 0.06 | 0.06 | 0.05 |
| F-slide | 6.69 | 6.80 | 3.47 | 9.61 | 2.00 | 2.99 | 2.71 | 4.27 | 4.21 | 1.85 |
| F-shift | 6.24 | 2.91 | 2.80 | 4.66 | 2.88 | 2.67 | 3.02 | 3.58 | 2.66 | 4.11 |
| F-rise | 21.34 | 21.98 | 17.48 | 24.79 | 14.51 | 14.25 | 14.66 | 18.41 | 17.31 | 14.24 |
| Roll | 1.05 | 2.01 | 3.60 | 0.61 | 5.60 | 4.68 | 6.02 | 2.44 | 1.70 | 3.50 |
| Tilt | −1.26 | 0.33 | −1.66 | 0.00 | 0.14 | −0.77 | 0.00 | 1.44 | 0.00 | 0.00 |
| Twist | 35.02 | 31.53 | 32.29 | 30.72 | 35.43 | 33.54 | 33.67 | 35.67 | 34.07 | 36.94 |
| Slide | −0.18 | −0.59 | −0.22 | −0.68 | 0.48 | −0.17 | 0.44 | −0.05 | −0.19 | 0.04 |
| Shift | 0.01 | −0.02 | −0.02 | 0.00 | 0.01 | 0.03 | 0.00 | −0.01 | 0.00 | 0.00 |
| Rise | 3.25 | 3.24 | 3.32 | 3.21 | 3.37 | 3.36 | 3.29 | 3.30 | 3.27 | 3.39 |
| Energy | −1.00 | −1.44 | −1.28 | −0.88 | −1.45 | −1.84 | −2.17 | −1.30 | −2.24 | −0.58 |
| Enthalpy | −7.60 | −8.40 | −7.80 | −7.20 | −8.50 | −8.00 | −10.60 | −8.20 | −9.80 | −7.20 |
| Entropy | −21.30 | −22.40 | −21.00 | −20.40 | −22.70 | −19.90 | −27.20 | −22.20 | −24.40 | −21.30 |
Figure 2.
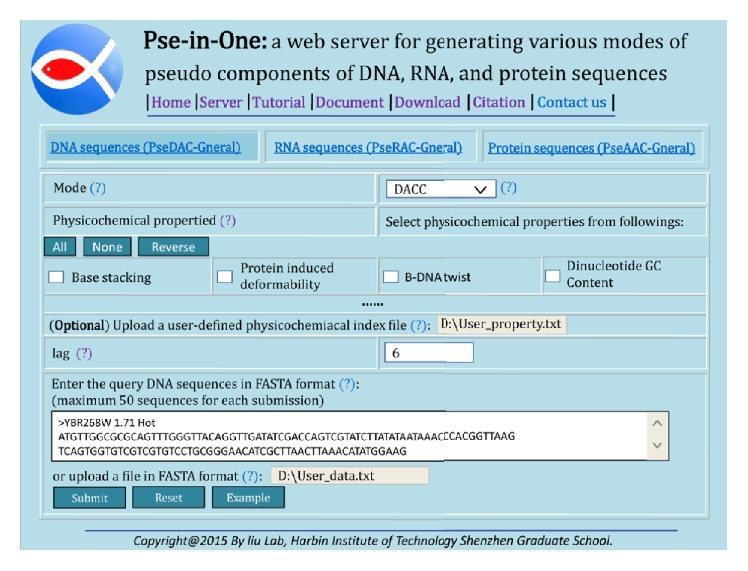
An example of the DACC features' generation by using Pse-in-One.
For stand-alone approach, DACC features can be easily generated by using the following command line:
-
‘./acc.py −e user_property −f svm −l +1 3 DNA DACC'
where −e user_property represents the user-defined physicochemical index file, −f svm and −l +1 have the same meaning with the above command line, the parameter lag equals 3, the sequence type is DNA, and the method used is DACC.
2.2.3. Pseudo Dinucleotide Composition (PseDNC)
Given a DNA sequence D represented as (2), the PseDNC feature vector D can be defined as [17]
| (5) |
where
| (6) |
where f k (1 ≤ k ≤ 16) represents the normalized frequency of dinucleotides along the DNA sequence; w (0 ≤ w ≤ 1) represents the weight factor; λ is the top counted tiers of the correlation in a DNA, θ j (1 ≤ j ≤ λ) measures the correlation between dinucleotides in the DNA, which is defined as
| (7) |
where
| (8) |
where μ represents the indices of the dinucleotide property; P μ(R i R i+1)(P μ(R j R j+1)) represents the value of dinucleotide R i R i+1(R j R j+1) at position i(j) for the dinucleotide property index μ.
Pseudo dinucleotide composition (PseDNC) [17] not only incorporates the local nucleic acid composition information and the global or long range information along the DNA sequences, but also incorporates the dinucleotide properties into feature vectors.
For web server approach, the generation steps of the feature vectors are similar to those of the DACC's. For web server approach, an example is shown in Figure 3.
Figure 3.
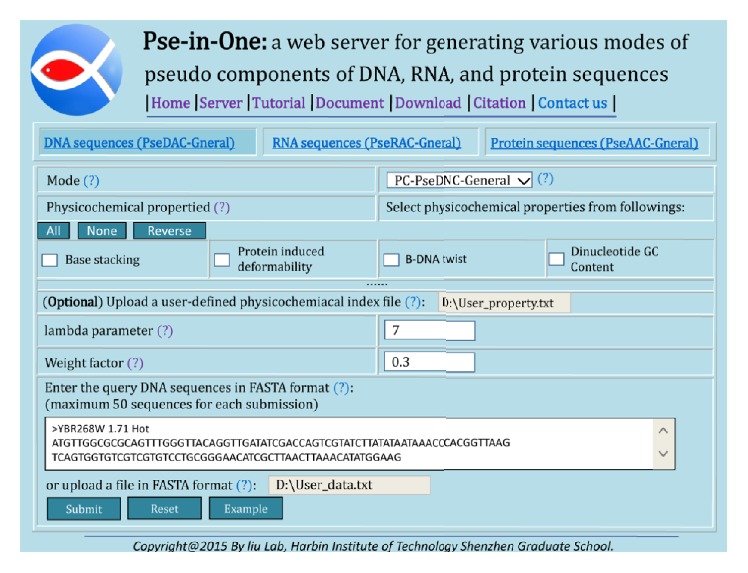
An example of the PseDNC features' generation by using Pse-in-One.
For stand-alone approach, the command line is
-
‘./pse.py −e user_property −f svm −l +1 7 0.3 DNA PseDNC'
where −e user_property, −f svm, and −l +1 have the same meaning with the above command line, lambda equals 7, the value of weight equals 0.3, the sequence type is DNA, and the method used is PseDNC.
The meanings of all the parameters for these scripts are described in [17].
2.3. Support Vector Machine (SVM)
Support Vector Machine (SVM) is a kind of algorithm based on statistical learning theory proposed by Vapnik [20–22], which has been widely used for many bioinformatics tasks [23–27].
In the current study, the LIBSVM package version 3.21 [18] has been employed. The SVM parameters, the kernel width parameter γ and the regularization parameter C, were optimized via the grid tool provided by LIBSVM [18].
In the current study, three basic predictors are proposed, including SVM-Kmer, SVM-DACC, and SVM-PseDNC. The values of SVM-Kmer's parameters are shown as follows:
| (9) |
The values of SVM-DACC's parameters are shown as follows:
| (10) |
The values of SVM-PseDNC's parameters are shown as follows:
| (11) |
2.4. Ensemble Learning
In machine learning, ensemble learning is the process by which multiple classifiers are constructed and combined based on the same dataset to obtain a better performance than a single classifier [28, 29] and existing popular multiobjective optimization evolutionary algorithms can be used for ensemble learning [30, 31]. Ensemble classifier also performed well in several bioinformatics problems. In the current study, the basic framework for an ensemble classifier is illustrated in Figure 4. The final results are obtained by fusing three individual classifier outcomes, as illustrated below.
Figure 4.
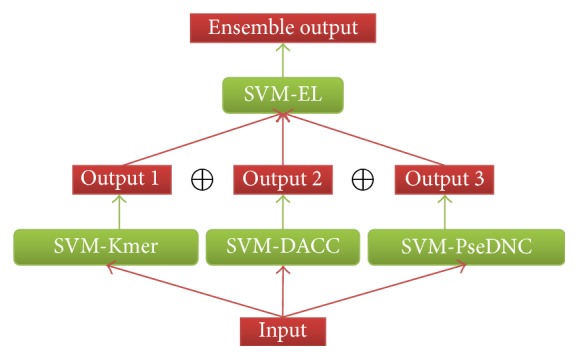
The basic framework for an ensemble classifier.
Suppose the ensemble classifier ℂ is defined as
| (12) |
where ℂ 1 represents the classifier SVM-Kmer, ℂ 2 represents the classifier SVM-DACC, and ℂ 3 represents the classifier SVM-PseDNC. The symbol ⊕ denotes the fusing operator.
Therefore, the process of the ensemble classifier can be formulated as follows:
| (13) |
where L 1 is the set only containing recombination hotspots and L 2 is the set of recombination coldspots. P i(S, L j) is the probability for DNA sequence S which belongs to category L i obtained by the ith basic classifier.
Thus, which category the query DNA S belongs to is to be determined by using its average probability calculated by (13); that is, suppose that
| (14) |
where the operator max represents selecting a lager value in the brackets, and the subscript μ represents the query DNA S belonging to category L μ.
2.5. Criteria for Performance Evaluation
The prediction results can be divided into true positive (TP), false negative (FN), false positive (FP), and true negative (TN) [32]. In the current study, jackknife test [33–37] was employed and four kinds of evaluation indexes were adopted, including Sensitivity (Se), Specificity (Sp), Accuracy (Acc), and Matthew's Correlation Coefficient (Mcc). They are described as
| (15) |
3. Results and Discussion
3.1. Performance of the Three Basic Classifiers
As an inherent property, sequence-order is important for the classification of DNA sequences. So, three basic methods based on sequence-order information are adopted to identify recombination hotspots/coldspots. Table 2 shows the performance of the three methods. According to the table, we can see that SVM-DACC and SVM-PseDNC outperform SVM-Kmer on the prediction accuracy index. The main reason is that SVM-Kmer is only based on local sequence-order information, while both of SVM-DACC and SVM-PseDNC also contain global sequence-order information.
Table 2.
Results on benchmark dataset for different predictors proposed in the current study.
| Predictor | Test method | Se (%) | Sp (%) | Acc (%) | MCC |
|---|---|---|---|---|---|
| SVM-Kmera | Jackknife | 75.92 | 86.29 | 81.59 | 0.628 |
| SVM-DACCb | Jackknife | 76.12 | 87.99 | 82.61 | 0.649 |
| SVM-PseDNCc | Jackknife | 72.04 | 90.69 | 82.24 | 0.644 |
| SVM-EL | Jackknife | 76.33 | 88.33 | 82.89 | 0.654 |
3.2. The Performance of the Three Basic Predictors Can Be Further Improved by Using Ensemble Learning
Based on the analysis above, we have proposed three basic predictors for identifying recombination hotspots/coldspots. These methods capture DNA information from different aspects. Therefore, we presented a complementary method SVM-EL which can fuse these basic methods to improve the prediction performance. The performance of SVM-EL is shown in Table 2, from which we can see that SVM-EL outperforms the three basic methods. Besides, the corresponding receiver operating characteristic (ROC) curves of the four classifiers were drawn in Figure 5. AUC, the area under the ROC curve, is often used to indicate the performance of a classifier: the larger the value, the better the classifier.
Figure 5.
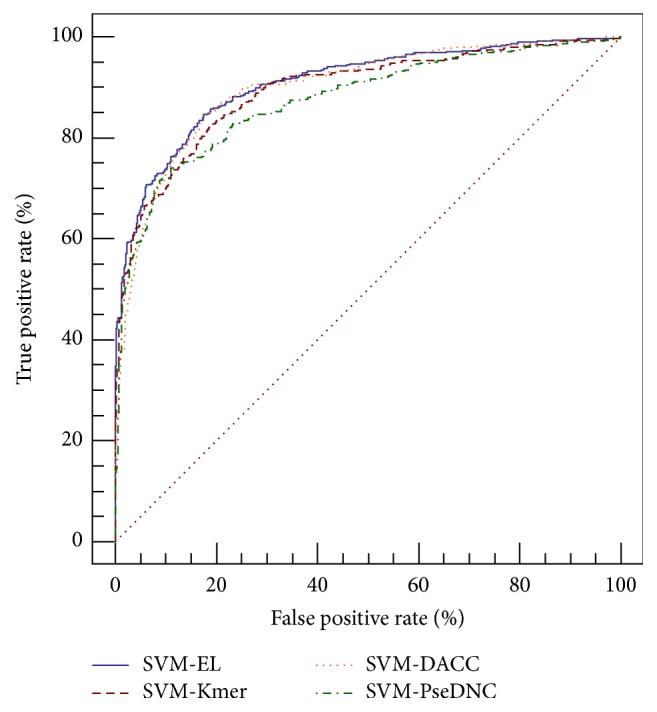
The comparison of different predictors for hotspots/coldspots identification. The areas under ROC curves (AUC) of SVM-EL, SVM-DACC, SVM-Kmer, and SVM-PseDNC are 0.91, 0.90, 0.89, and 0.87, respectively.
As shown in Figure 5, the predictor SVM-EL showed the top performance, outperforming three basic methods: SVM-Kmer, SVM-DACC, and SVM-PseDNC.
3.3. Comparison with Other Related Predictors
Two state-of-the-art methods, IDQD [10] and iRSpot-PseDNC, were selected to compare with the proposed SVM-EL. Table 3 shows the results of various methods on the benchmark dataset.
Table 3.
Results on benchmark dataset for different predictors.
| Predictor | Test method | Se (%) | Sp (%) | Acc (%) | MCC |
|---|---|---|---|---|---|
| IDQDa | 5-fold | 79.40 | 81.00 | 80.30 | 0.603 |
| iRSpot-PseDNCb | Jackknife | 73.06 | 89.49 | 82.04 | 0.638 |
| SVM-EL | Jackknife | 76.33 | 88.33 | 82.89 | 0.654 |
According to Table 3, we can see that SVM-EL outperforms the other methods. The main reason is that IDQD and SVM-Kmer only consider local sequence-order information, and iRSpot-PseDNC, SVM-DACC, and SVM-PseDNC improved them by incorporating global sequence-order information. However, SVM-EL not only incorporates the local nucleic acid information, but also incorporates the global information. Therefore, we conclude that SVM-EL would be a useful tool for hotspots/coldspots identification.
4. Conclusion
In this article, we proposed a predictor called SVM-EL for yeast hotspot/coldspot identification, which combines Support Vector Machine (SVM) with Ensemble Learning (EL). The approach combined with different predictors trained by different features contributes to the improvement of prediction accuracy. SVM-EL is trained by different features, including basic kmer (Kmer), dinucleotide-based auto-cross covariance (DACC), and pseudo dinucleotide composition (PseDNC). All these features can be generated by Pse-in-One [17], which is a powerful web server for generating various DNA, RNA, or protein features. It also provides a stand-alone version to users, which is easy to use. Via jackknife test, it was observed that the predictor outperforms other predictors. In the future, we will consider using other approaches for yeast hotspot/coldspot identification, such as bioinspired computing models [38–45].
Acknowledgments
This work was supported by the National High Technology Research and Development Program of China (863 Program) (2015AA015405), the National Natural Science Foundation of China (nos. 61300112, 61573118, 61272383, and 61572151), the Natural Science Foundation of Guangdong Province (2014A030313695), Guangdong Natural Science Funds for Distinguished Yong Scholars (2016A030306008), and Scientific Research Foundation in Shenzhen (Grant no. JCYJ20150626110425228).
Competing Interests
The authors declare no competing financial interests.
Authors' Contributions
Bingquan Liu conceived the study and designed the experiments and participated in designing the study, drafting the manuscript, and performing the statistical analysis. Yumeng Liu participated in coding the experiments and drafting the manuscript. Dong Huang participated in performing the statistical analysis. All authors read and approved the final manuscript. Bingquan Liu and Yumeng Liu contributed equally to this paper.
References
- 1.Lynn A., Ashley T., Hassold T. Variation in human meiotic recombination. Annual Review of Genomics and Human Genetics. 2004;5:317–349. doi: 10.1146/annurev.genom.4.070802.110217. [DOI] [PubMed] [Google Scholar]
- 2.Spencer C. C. A., Deloukas P., Hunt S., et al. The influence of recombination on human genetic diversity. PLoS Genetics. 2006;2(9, article e148) doi: 10.1371/journal.pgen.0020148. [DOI] [PMC free article] [PubMed] [Google Scholar]
- 3.Galtier N., Piganeau G., Mouchiroud D., Duret L. GC-content evolution in mammalian genomes: the biased gene conversion hypothesis. Genetics. 2001;159(2):907–911. doi: 10.1093/genetics/159.2.907. [DOI] [PMC free article] [PubMed] [Google Scholar]
- 4.Lercher M. J., Hurst L. D. Human SNP variability and mutation rate are higher in regions of high recombination. Trends in Genetics. 2002;18(7):337–340. doi: 10.1016/S0168-9525(02)02669-0. [DOI] [PubMed] [Google Scholar]
- 5.Baudat F., Nicolas A. Clustering of meiotic double-strand breaks on yeast chromosome III. Proceedings of the National Academy of Sciences of the United States of America. 1997;94(10):5213–5218. doi: 10.1073/pnas.94.10.5213. [DOI] [PMC free article] [PubMed] [Google Scholar]
- 6.Klein S., Zenvirth D., Dror V., Barton A. B., Kaback D. B., Simchen G. Patterns of meiotic double-strand breakage on native and artificial yeast chromosomes. Chromosoma. 1996;105(5):276–284. doi: 10.1007/BF02524645. [DOI] [PubMed] [Google Scholar]
- 7.Zenvirth D., Arbel T., Sherman A., Goldway M., Klein S., Simchen G. Multiple sites for double-strand breaks in whole meiotic chromosomes of Saccharomyces cerevisiae . The EMBO Journal. 1992;11(9):3441–3447. doi: 10.1002/j.1460-2075.1992.tb05423.x. [DOI] [PMC free article] [PubMed] [Google Scholar]
- 8.Mancera E., Bourgon R., Brozzi A., Huber W., Steinmetz L. M. High-resolution mapping of meiotic crossovers and non-crossovers in yeast. Nature. 2008;454(7203):479–485. doi: 10.1038/nature07135. [DOI] [PMC free article] [PubMed] [Google Scholar]
- 9.Gerton J. L., DeRisi J., Shroff R., Lichten M., Brown P. O., Petes T. D. Global mapping of meiotic recombination hotspots and coldspots in the yeast Saccharomyces cerevisiae. Proceedings of the National Academy of Sciences of the United States of America. 2000;97(21):11383–11390. doi: 10.1073/pnas.97.21.11383. [DOI] [PMC free article] [PubMed] [Google Scholar]
- 10.Liu G., Liu J., Cui X., Cai L. Sequence-dependent prediction of recombination hotspots in Saccharomyces cerevisiae . Journal of Theoretical Biology. 2012;293:49–54. doi: 10.1016/j.jtbi.2011.10.004. [DOI] [PubMed] [Google Scholar]
- 11.Wang R., Xu Y., Liu B. Recombination spot identification Based on gapped k-mers. Scientific Reports. 2016;6, article 23934 doi: 10.1038/srep23934. [DOI] [PMC free article] [PubMed] [Google Scholar] [Retracted]
- 12.Chen W., Feng P.-M., Lin H., Chou K.-C. IRSpot-PseDNC: identify recombination spots with pseudo dinucleotide composition. Nucleic Acids Research. 2013;41(6, article e68) doi: 10.1093/nar/gks1450. [DOI] [PMC free article] [PubMed] [Google Scholar]
- 13.Liu B., Liu F., Fang L., Wang X., Chou K.-C. repDNA: a Python package to generate various modes of feature vectors for DNA sequences by incorporating user-defined physicochemical properties and sequence-order effects. Bioinformatics. 2015;31(8):1307–1309. doi: 10.1093/bioinformatics/btu820. [DOI] [PubMed] [Google Scholar]
- 14.Dong Q., Zhou S., Guan J. A new taxonomy-based protein fold recognition approach based on autocross-covariance transformation. Bioinformatics. 2009;25(20):2655–2662. doi: 10.1093/bioinformatics/btp500. [DOI] [PubMed] [Google Scholar]
- 15.Chen W., Zhang X., Brooker J., Lin H., Zhang L., Chou K.-C. PseKNC-General: a cross-platform package for generating various modes of pseudo nucleotide compositions. Bioinformatics. 2015;31(1):119–120. doi: 10.1093/bioinformatics/btu602. [DOI] [PubMed] [Google Scholar]
- 16.Liu B., Long R., Chou K.-C. iDHS-EL: identifying DNase I hypersensitive sites by fusing three different modes of pseudo nucleotide composition into an ensemble learning framework. Bioinformatics. 2016;32(16):2411–2418. doi: 10.1093/bioinformatics/btw186. [DOI] [PubMed] [Google Scholar]
- 17.Liu B., Liu F., Wang X., Chen J., Fang L., Chou K.-C. Pse-in-One: a web server for generating various modes of pseudo components of DNA, RNA, and protein sequences. Nucleic Acids Research. 2015;43(1):W65–W71. doi: 10.1093/nar/gkv458. [DOI] [PMC free article] [PubMed] [Google Scholar]
- 18.Chang C.-C., Lin C.-J. LIBSVM: a library for support vector machines. ACM Transactions on Intelligent Systems and Technology. 2011;2, article 27 doi: 10.1145/1961189.1961199. [DOI] [Google Scholar]
- 19.Guo Y., Yu L., Wen Z., Li M. Using support vector machine combined with auto covariance to predict protein-protein interactions from protein sequences. Nucleic Acids Research. 2008;36(9):3025–3030. doi: 10.1093/nar/gkn159. [DOI] [PMC free article] [PubMed] [Google Scholar]
- 20.Vapnik V. N. Statistical Learning Theory. New York, NY, USA: John Wiley & Sons; 1998. [Google Scholar]
- 21.Wu Y., Krishnan S. Combining least-squares support vector machines for classification of biomedical signals: a case study with knee-joint vibroarthrographic signals. Journal of Experimental and Theoretical Artificial Intelligence. 2011;23(1):63–77. doi: 10.1080/0952813x.2010.506288. [DOI] [Google Scholar]
- 22.Liu B., Fang L., Long R., Lan X., Chou K. iEnhancer-2L: a two-layer predictor for identifying enhancers and their strength by pseudo k-tuple nucleotide composition. Bioinformatics. 2016;32(3):362–369. doi: 10.1093/bioinformatics/btv604. [DOI] [PubMed] [Google Scholar]
- 23.Chen J., Wang X., Liu B. IMiRNA-SSF: improving the identification of MicroRNA precursors by combining negative sets with different distributions. Scientific Reports. 2016;6, article 19062 doi: 10.1038/srep19062. [DOI] [PMC free article] [PubMed] [Google Scholar]
- 24.Liu B., Zhang D., Xu R., et al. Combining evolutionary information extracted from frequency profiles with sequence-based kernels for protein remote homology detection. Bioinformatics. 2014;30(4):472–479. doi: 10.1093/bioinformatics/btt709. [DOI] [PMC free article] [PubMed] [Google Scholar]
- 25.Zou Q., Mao Y., Hu L., Wu Y., Ji Z. miRClassify: an advanced web server for miRNA family classification and annotation. Computers in Biology and Medicine. 2014;45(1):157–160. doi: 10.1016/j.compbiomed.2013.12.007. [DOI] [PubMed] [Google Scholar]
- 26.Chen W., Lin H. Prediction of midbody, centrosome and kinetochore proteins based on gene ontology information. Biochemical and Biophysical Research Communications. 2010;401(3):382–384. doi: 10.1016/j.bbrc.2010.09.061. [DOI] [PubMed] [Google Scholar]
- 27.Li D., Ju Y., Zou Q. Protein folds prediction with hierarchical structured SVM. Current Proteomics. 2016;13(2):79–85. doi: 10.2174/157016461302160514000940. [DOI] [Google Scholar]
- 28.Liu B., Wang S., Wang X. DNA binding protein identification by combining pseudo amino acid composition and profile-based protein representation. Scientific Reports. 2015;5 doi: 10.1038/srep15479.15479 [DOI] [PMC free article] [PubMed] [Google Scholar]
- 29.Wu M., Liao L., Luo X., et al. Analysis and classification of stride patterns associated with children development using gait signal dynamics parameters and ensemble learning algorithms. BioMed Research International. 2016;2016:8. doi: 10.1155/2016/9246280.9246280 [DOI] [PMC free article] [PubMed] [Google Scholar]
- 30.Zhang X., Tian Y., Cheng R., Jin Y. An efficient approach to nondominated sorting for evolutionary multiobjective optimization. IEEE Transactions on Evolutionary Computation. 2015;19(2):201–213. doi: 10.1109/tevc.2014.2308305. [DOI] [Google Scholar]
- 31.Zhang X., Tian Y., Jin Y. A knee point-driven evolutionary algorithm for many-objective optimization. IEEE Transactions on Evolutionary Computation. 2015;19(6):761–776. doi: 10.1109/TEVC.2014.2378512. [DOI] [Google Scholar]
- 32.Wu Y., Chen P., Luo X., et al. Quantification of knee vibroarthrographic signal irregularity associated with patellofemoral joint cartilage pathology based on entropy and envelope amplitude measures. Computer Methods and Programs in Biomedicine. 2016;130:1–12. doi: 10.1016/j.cmpb.2016.03.021. [DOI] [PubMed] [Google Scholar]
- 33.Liu B., Xu J., Lan X., et al. iDNA-Prot|dis: identifying DNA-binding proteins by incorporating amino acid distance-pairs and reduced alphabet profile into the general pseudo amino acid composition. PLoS ONE. 2014;9(9) doi: 10.1371/journal.pone.0106691.e106691 [DOI] [PMC free article] [PubMed] [Google Scholar]
- 34.Chen W., Lin H. Identification of voltage-gated potassium channel subfamilies from sequence information using support vector machine. Computers in Biology and Medicine. 2012;42(4):504–507. doi: 10.1016/j.compbiomed.2012.01.003. [DOI] [PubMed] [Google Scholar]
- 35.Chen W., Feng P., Lin H. Prediction of ketoacyl synthase family using reduced amino acid alphabets. Journal of Industrial Microbiology and Biotechnology. 2012;39(4):579–584. doi: 10.1007/s10295-011-1047-z. [DOI] [PubMed] [Google Scholar]
- 36.Liu B., Chen J., Wang X. Application of learning to rank to protein remote homology detection. Bioinformatics. 2014;31(21):3492–3498. doi: 10.1093/bioinformatics/btv413. [DOI] [PubMed] [Google Scholar]
- 37.Liu B., Fang L., Liu F., Wang X., Chen J., Chou K.-C. Identification of real microRNA precursors with a pseudo structure status composition approach. PLoS ONE. 2015;10(3) doi: 10.1371/journal.pone.0121501.e0121501 [DOI] [PMC free article] [PubMed] [Google Scholar]
- 38.Song T., Xu J., Pan L. On the universality and non-universality of spiking neural P systems with rules on synapses. IEEE Transactions on NanoBioscience. 2015;14(8):960–966. doi: 10.1109/tnb.2015.2503603. [DOI] [PubMed] [Google Scholar]
- 39.Song T., Pan L. Spiking neural P systems with request rules. Neurocomputing. 2016;193:193–200. doi: 10.1016/j.neucom.2016.02.023. [DOI] [Google Scholar]
- 40.Wang X., Song T., Gong F., Zheng P. On the computational power of spiking neural P systems with self-organization. Scientific Reports. 2016;6 doi: 10.1038/srep27624.27624 [DOI] [PMC free article] [PubMed] [Google Scholar]
- 41.Zhang X., Pan L., Păun A. On the universality of axon P systems. IEEE Transactions on Neural Networks and Learning Systems. 2015;26(11):2816–2829. doi: 10.1109/tnnls.2015.2396940. [DOI] [PubMed] [Google Scholar]
- 42.Zeng X., Xu L., Liu X., Pan L. On languages generated by spiking neural P systems with weights. Information Sciences. 2014;278:423–433. doi: 10.1016/j.ins.2014.03.062. [DOI] [Google Scholar]
- 43.Zeng X., Zhang X., Song T., Pan L. Spiking neural P systems with thresholds. Neural Computation. 2014;26(7):1340–1361. doi: 10.1162/NECO_a_00605. [DOI] [PubMed] [Google Scholar]
- 44.Zhang X., Liu Y., Luo B., Pan L. Computational power of tissue P systems for generating control languages. Information Sciences. 2014;278:285–297. doi: 10.1016/j.ins.2014.03.053. [DOI] [Google Scholar]
- 45.Liu B., Wang S., Dong Q., Li S., Liu X. Identification of DNA-binding proteins by combining auto-cross covariance transformation and ensemble learning. IEEE Transactions on NanoBioscience. 2016;15(4):328–334. doi: 10.1109/TNB.2016.2555951. [DOI] [PubMed] [Google Scholar]


