
Figure 5.
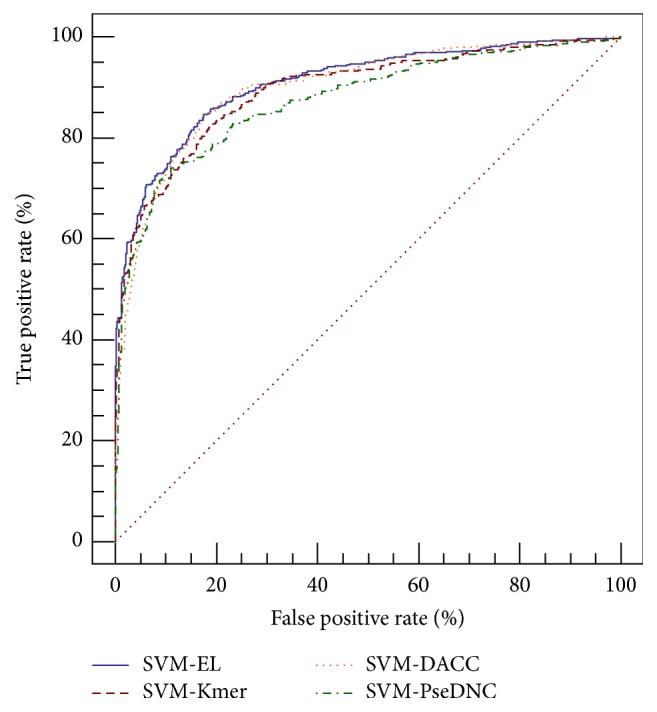
The comparison of different predictors for hotspots/coldspots identification. The areas under ROC curves (AUC) of SVM-EL, SVM-DACC, SVM-Kmer, and SVM-PseDNC are 0.91, 0.90, 0.89, and 0.87, respectively.
Official websites use .gov
A
.gov website belongs to an official
government organization in the United States.
Secure .gov websites use HTTPS
A lock (
) or https:// means you've safely
connected to the .gov website. Share sensitive
information only on official, secure websites.
The comparison of different predictors for hotspots/coldspots identification. The areas under ROC curves (AUC) of SVM-EL, SVM-DACC, SVM-Kmer, and SVM-PseDNC are 0.91, 0.90, 0.89, and 0.87, respectively.