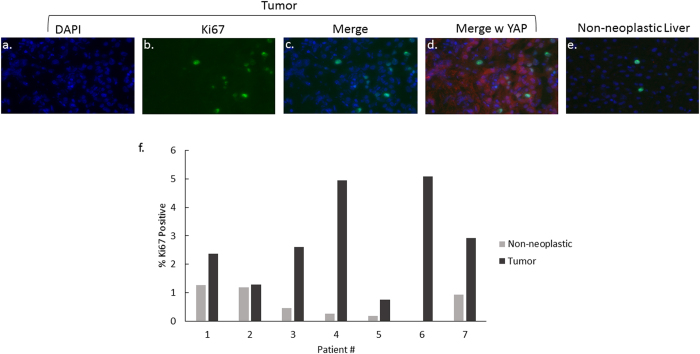
Figure 4. Ki67 expression in moderately differentiated pediatric HCC compared to non-neoplastic liver.
Representative examples of tumor and matched non-neoplastic liver are shown at 40x (panels a–e). (Panel f) represents the percentage of Ki67 positive cells in both tumor and non-neoplastic tissue for each patient. Ki67 was increased in all 7 of the tumors.

