
Figure 5. YAP and Ki67 co-localization in tumor and non-neoplastic liver.
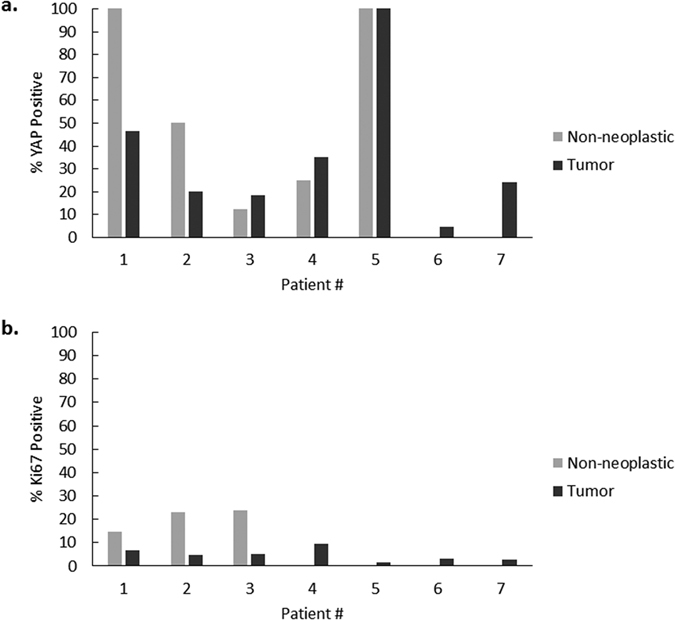
Panel a represents the percentage of Ki67 positive cells that are also YAP positive. With the exception of Patient 5, all tumors had less than 60% of Ki67 positive cells which were also YAP positive. Panel b represents the percentage of YAP positive cells that are also Ki67 positive. This constituted less than 10% of cells in all tumors.