
Figure 7. Hippo array expression heatmap.
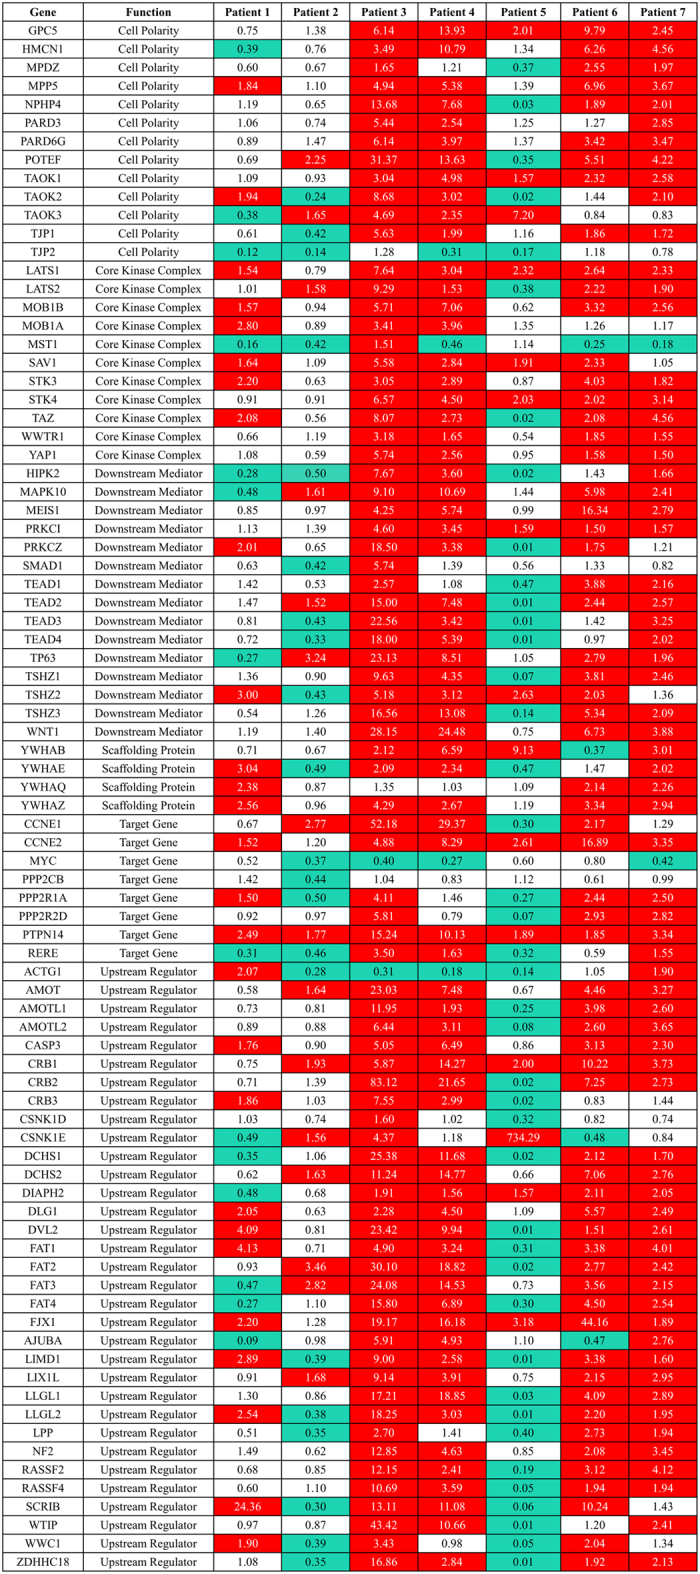
Cells highlighted in red represent genes upregulated by 50% and cells highlighted in blue represent genes downregulated by 50% or more in tumor tissue compared to non-neoplastic liver.
Official websites use .gov
A
.gov website belongs to an official
government organization in the United States.
Secure .gov websites use HTTPS
A lock (
) or https:// means you've safely
connected to the .gov website. Share sensitive
information only on official, secure websites.
Cells highlighted in red represent genes upregulated by 50% and cells highlighted in blue represent genes downregulated by 50% or more in tumor tissue compared to non-neoplastic liver.