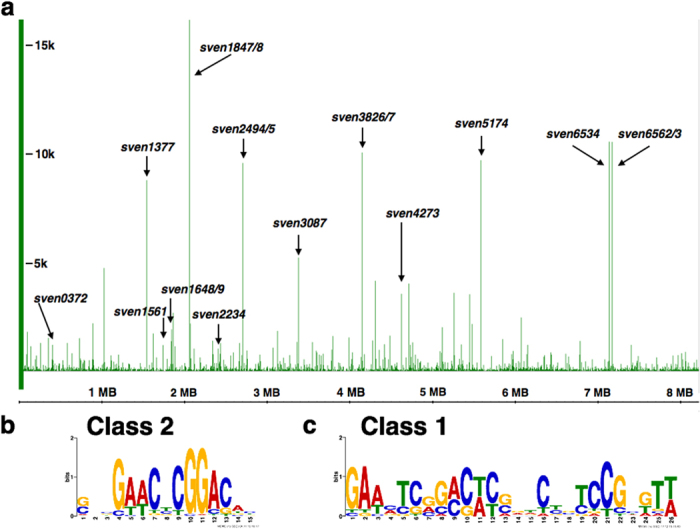
Figure 1. Defining the regulon and binding site for RsrR.

Top panel (a) shows the whole genome ChIP-seq analysis with class 1 sites labeled in black. The frequency of each base sequenced is plotted with genomic position on the x-axis and frequency of each base sequenced on the y-axis for S. venezualae (NC_018750). Bottom panel (b) shows the class 1 and 2 web logos generated following MEME analysis of the ChIP-seq data.
